Data and Results Summaries
Participation and Outcomes
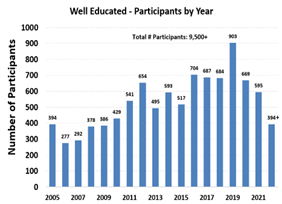
The Well Educated program has been in place since 2005 and has reached more than 10,000 participants in the last 19 years. The program guides private well owners through testing and understanding their home well water quality and provides information about how to protect the health of those using the water through water treatment and/or groundwater protection. The water quality data produced by the program is summarized to help others know what is most important to test for in different areas. 93% of participants indicated that the program made it easy for them to understand their water quality and 96% indicated they would participate in the program again.
|
|
|
Program Test Results Summary
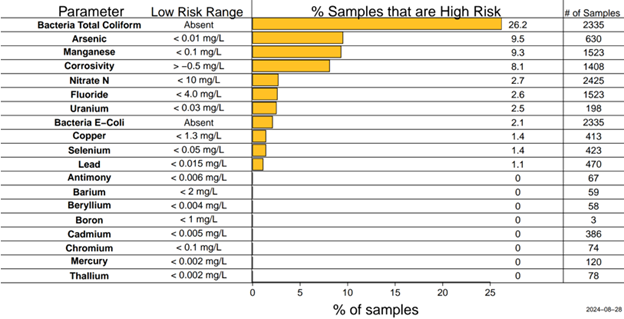
The Well Educated program provides insights about the biggest water quality concerns statewide and at the county level. The statewide data summary is presented in the figure below where the size of the orange bar indicates how common the problem is. Total Coliform bacteria is the most common issue, which does not pose a direct health risk, but indicates that surface processes could be influencing the water quality and the condition of the well should be investigated. Manganese, arsenic, nitrate, E. coli, fluoride, uranium, selenium, copper, and lead are the other parameters that show up at health concern levels most commonly. Click here to watch a 2 minute video on how to interpret the figure showing statewide testing results. Parallel results are also available for each county with sufficient program participation by visiting the interactive map at this link.
Additional Statewide Groundwater Quality Results
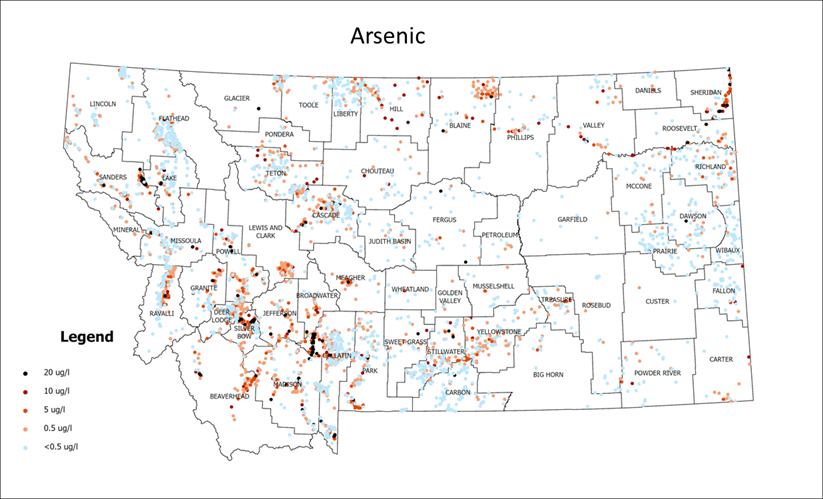
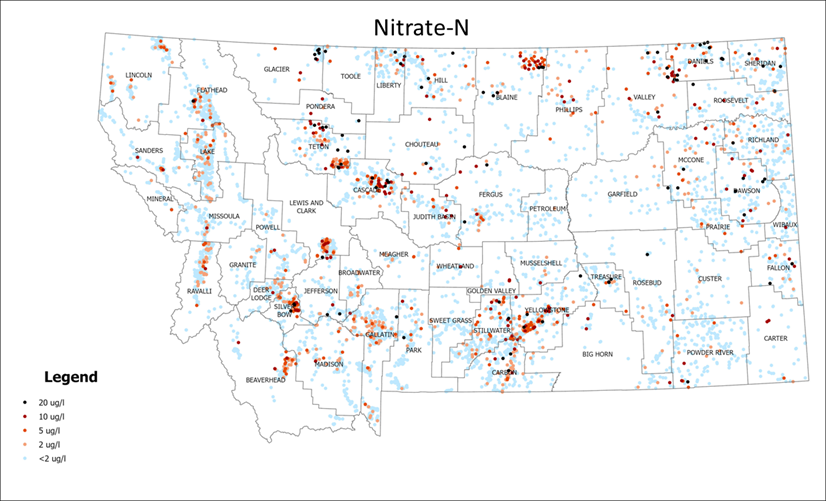
In addition to the Well Educated program data, we are working to leverage other groundwater data to inform well owners about potential risks. The Montana Bureau of Mines and Geology, Groundwater Information Center (GWIC) has a wealth of groundwater data. The maps below show concentrations of arsenic (primarily from natural sources) and nitrate (from human sources) in groundwater across Montana. An interactive map of these and more data is available here; click here for a 5 minute video on how to use the map.
Cumulative Human Health Risk from Groundwater
Assessing water quality related to human health is typically done for individual parameters by comparing the concentration in the sample to a threshold. The most common thresholds to use in the US are the values that are required by law for public water supplies, which are called Maximum Contaminant Levels (MCLs). There are two possible shortcomings of this approach:
- There are parameters with known health issues that do not have MCLs and in some cases there are health risks at concentrations below MCL.
- Assessing parameters individually does not account for possible additive effects from exposure to contaminants together.
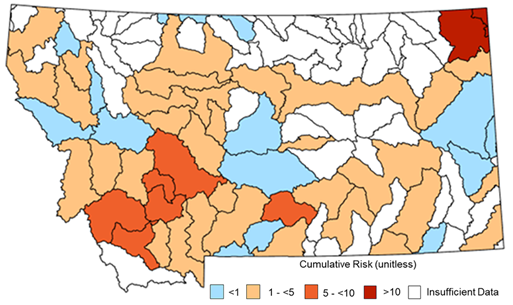
Our team has conducted a statewide analysis of Montana groundwater, applying a relatively simplistic cumulative risk assessment that addresses the two points above. The assessment found that more than half of the wells in 75% of Montana watersheds with sufficient data had cumulative human health risk value greater than 1, indicating concerns for more vulnerable members of the population with a lifetime exposure. Arsenic and uranium are the two parameters contributing most to the risk statewide, but results vary across the state. A website describing these results in more detail is coming soon.
