
Data Management
Data Management Standard Operating Procedures (SOPs)
Time and effort is spent in the planning and development stage of any monitoring program, careful thought has gone into what parameters should be collected and how should they be collected. Often times the planning stops after the monitoring design is complete and the data is never properly filed or stored. In order to make the best use of data collected, it is important to have a plan in place for how the data management and file organization will be conducted. With a solid plan, it will be easy to find data in the future.
1.1 Make field sheets mirror only what is being collected
Data management starts before data is even collected. It is important to have a well-designed field sheet that represents only the parameters you are observing and collecting. It is easy to modify field sheets to be unique to your needs. Field sheet examples can be found on the Montana State University Extension Water Quality (MSUEWQ) Webpage. There is no right or wrong way to make a field sheet. The most important part is to make sure everything you are collecting is represented on the field sheet (even if it is not collected every visit). It is also important not to include information on the field sheet that will not be collected. This creates many blank spots on a field sheet and makes it more difficult to determine if everything is properly filled out on the field sheet.
1.2 Ensure field sheets are properly filled out and delivered to the monitoring coordinator
2.1 Field datasheet management: digital copies.
2.2 Field datasheet management: hard copies
After scanning field datasheets, it is important to file the hard copy as well. Organize file folders by sample sites or sampling dates and make sure to always file the hard copies after scanning.
3.1 Tips, Tricks and Examples
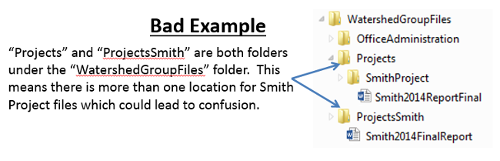
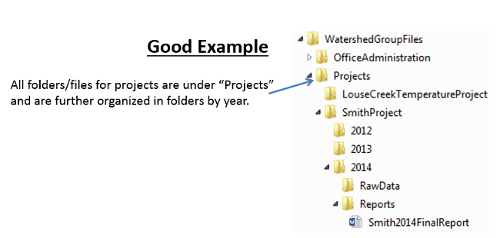
3.2 Folder Naming and Structure
A well organized folder structure will help you find files quickly and ultimately save you a lot of time. In general, a good folder structure means there is one and only one location where you would save a file and it is easy to navigate quickly to that location.
The best folder structure will look different for everyone but a key is to identify the most sensible ways to separate your information into groups for you and others in your organization. When you open your computer to look for a file, what characteristic of that file comes to mind first? ---the year it was done? --- the watershed or stream? --- the project name? --- the landowner name? --- the type of project? --- These are the types of things that should be part of your folder structure. The goal is to lay out a structure where every file has a place and ONLY ONE place which is intuitive. It is useful to go through this process with someone else in your organization so the structure you come up with makes sense to more people.
3.3 File Naming and Structure
File names should be descriptive enough to tell you quickly what is in the file and ideally should tell you which file is the latest version. Consistency in file naming is more important than exactly how you decide to name them.
Naming Files
The beginning of a file name is important for 2 reasons; 1) that is where your eye goes quickly when scanning; 2) this is what will determine the order of files when they are sorted by name. Considerations for a good file name have some relation to your folder structure. For example, if all of your files for a project are in a folder named for that project, it is less important that the project name is included in the file name.
Date and initials as pare of the file name
Most files we work on are updated through time, possibly by multiple people; keeping track of the latest version is critical and can be challenging. Consider putting a date and possibly a time and initials at the end of your file names. If you put the date in the format of YEAR-MONTH-DAY, then the newest version will always be at the bottom of the list. If the last person to edit a file always puts their initials at the end of the file name, then you can always tell what person edited a file last and on what day. You cannot always rely on the date modified stamp that window's puts on a file; because this information is lost sometimes when a file is transferred.
4.1 Data Entry
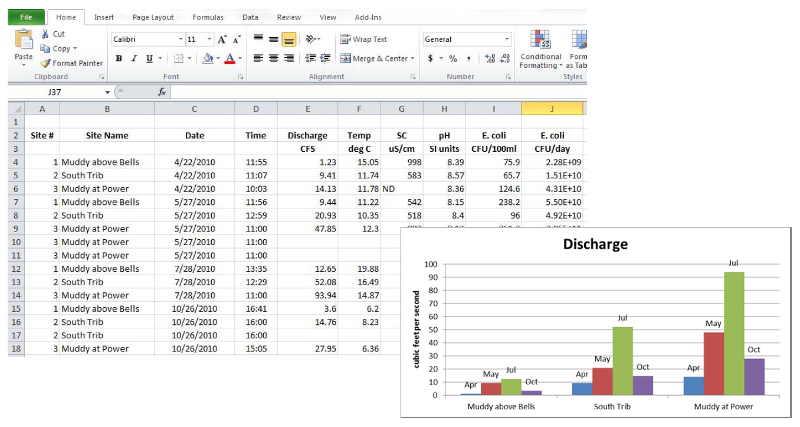
Most people will enter the data in a format that looks like the example below. The column headings contain site name, date, parameters, etc and the rows are populated with the information from individual sampling events. Entering data in this manner will make the data easier to communicate findings to broader groups through tables, graphs and figures.
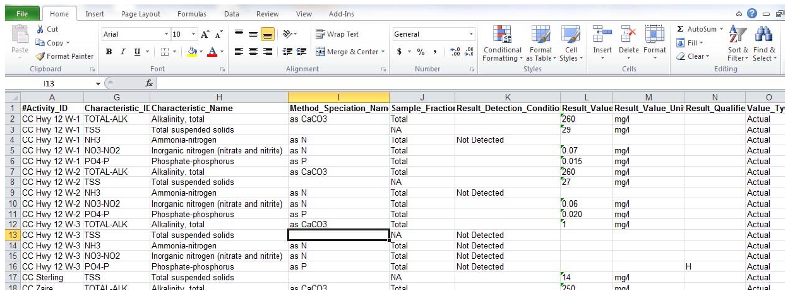
If you are required to upload data to EQUIS, consider using the EQUIS csv template as the starting point and populating it with collected field and lab data. The EQUIS format requires each row in Excel to contain information for one sample point. This is valuable for allowing you to include information about how the data was collected and analyzed, but this method makes it more difficult to produce graphs. It save time and frustration if uploading data to EQUIS is main priority.
Another option, besides Excel, is to keep data in an Access database. Setting up the database can be challenging, but once the spreadsheets are set up and formatted correctly, it can make data entry and analysis very easy. Keeping data in Access is recommended for advanced database users.
Metadata
Quality Control
Entering data off of field datasheets or from a lab can be a tedious process and it is easy to mis-key a number. Always take time to enter the numbers to ensure you are keying in the correct information. If there is a volunteer to help with the process, it can be beneficial to have one person read off the values from the field datasheet and have the other person enter the number. This way you have two people double checking what gets entered on the computer. Another simple quality control check is to randomly choose 10% of the field datasheets and check those values in the Excel sheet.
4.2 Storage
Local Storage
Local storage refers to storage on a computer, share drive or hard drive at the office. Local storage is where the raw data, project documents, and field datasheets will live. It's important to designate a specific location where all documents will be housed for everyone who works on the project so that all files will be stored appropriately. It is also important to have a backup of all project files that will live on a share drive (Dropbox, Google Drive, etc.) and a hard drive. If files are backed up on a share drive, you are not at a loss if a computer crashes or if you have employee turnover.
Public Databases
There are options out there to allow you upload data to a public database that can be viewed by the public. In Montana, the Department of Environmental Quality (DEQ) has an online repository for storing water quality monitoring data, which includes physical, chemical, biological, and habitat data from a variety of projects across the state.. This database is called EQUIS, and some project data will be required to be uploaded to EQUIS if funds by DEQ money.
Another public database option is the MSUEWQ Data Hub. In order to upload data to the Data Hub you need to collaborate with MSUEWQ. This web-database provides storage and visualization of surface water data and photos collected by citizen scientists and groups across Montana. There are basic plotting tools built in or data can be downloaded. Site lists can also be exported with coordinates and hyperlinks to add to interactive online maps. More information on the Data Hub can be found here.
SAP/SOP Storage
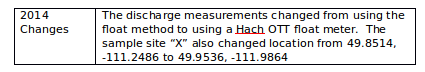
It is important to update the project SAP and SOP each year to accurately represent all pertinent information about the monitoring (site information, parameters collected, volunteers, etc.). The changes should happen at the beginning of each year before monitoring has started and to keep track of the changes from year to year, a track changes table should be added the beginning of each document that overviews the changes made and when.
As mentioned previously, SAP and SOPs should be housed in a designated location
on a share drive with all the other project files.
4.3 Data Use