
New User Guide
Updated: April 20th, 2020
This document provides guidance for uploading and downloading data from the MSUEWQ Data Hub. Uploading data requires a username which must be created by MSUEWQ staff. Viewing and downloading data is possible without a username.
Download a PDF version of this webpage
The MSUEWQ Data Hub was created to house volunteer monitoring data collected in Montana. This tool provides a platform for users to easily upload data to an internet-based database and have that data be immediately available and readily downloadable by the general public.
The types of data that can be stored and viewed are 1) stream discharge and water quality data, and 2) photopoints and/or general photos of your stream monitoring sites.
 |
 |
There are two ways to view the data: 1) within the Data Viewer interface, and 2) within the Map of Sites interface. Neither option requires login credentials
The Data Viewer
1. Navigate to the Data Viewer on the Data Hub portal.
2. To view data, you must first select a site(s) at the bottom of the page and a desired date range (above the site selection).
3. Once a site and a date range is selected, you can start to interact with the data.
The interactive features include: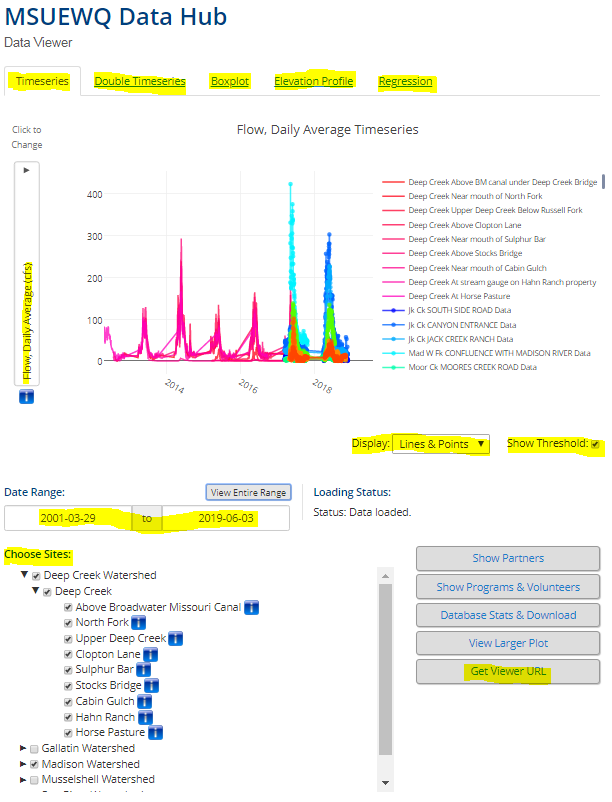
- There are five different ways to view the data: a timeseries, double timeseries, boxplot, elevation profile, or regressions. These options are listed across the top of the page.
- You can change which parameter you want to view the data for on a drop-down box. These drop-downs will appear on the y-axis (or axes)/x-axis, depending on the type of plot you choose (step i above).
- You can choose to display lines and points, just lines, or just points.
- Selecting the “Show Threshold” box will display a line on the plot that represents the standard for the parameter(s) you are viewing.
- Clicking on the arrows next to the sites will display a drop-down list of individual sites within that watershed.
- Click “Get Viewer URL” on the bottom right of the page to obtain a URL that will link directly to the data you are viewing.
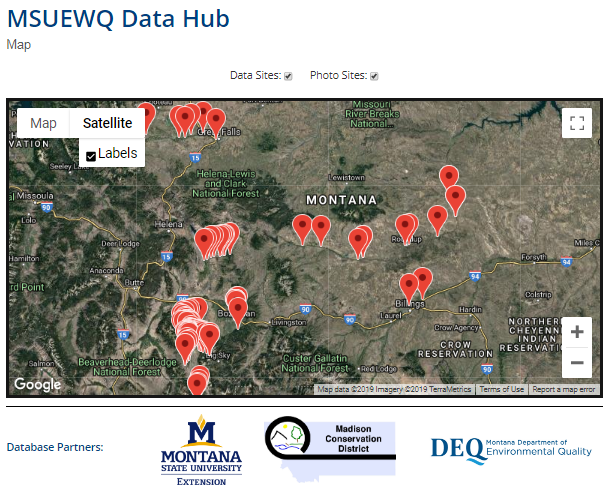
1. Navigate to the Map of Sites on the Data Hub portal.
2. This map displays the locations of all of the sites within the Data Hub. You can expand the map and zoom in and out.
3. Select/unselect “Data Sites” or “Photo Sites” to add/remove sites from the map based on whether they have data or photos associated with them.
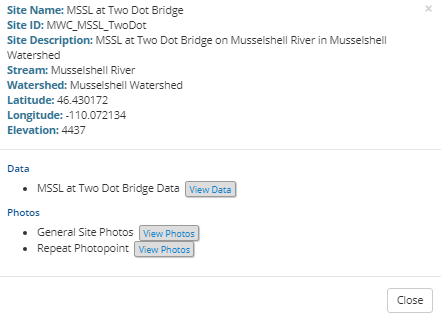
4. Clicking on sites will bring up a box containing general site information and links to view the data and/or photos associated with that site. These links will bring up a data viewing interface that is essentially identical to the Data Viewer (see above section).
|
|
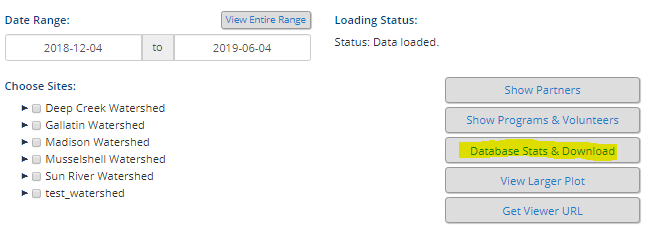
1. Navigate to the Data Viewer interface within the Data Hub.
2. Select “Database Stats & Download” on the bottom right.
3. Select the site(s) you want to download data for, enter the desired date range, and click “Download Data”.
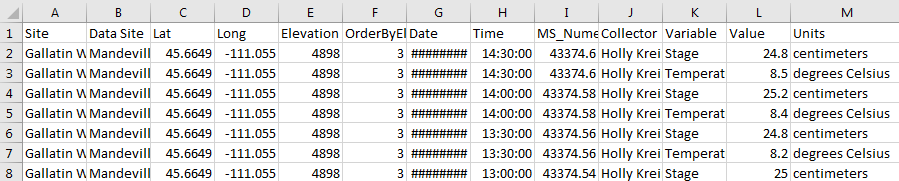
4. The downloaded data file will be in .csv format.
|
|
|
|
Inquiring with MSUEWQ about access
Write an email (addressed to both asigler@montana.edu and ExtensionWater@montana.edu, answering the following questions to the best of your ability.
- What organization or program was the data collected by?
- Is there a volunteer or citizen component to the data collection?
- What watershed was the data collected in?
- What is the approximate number of sites you have data for?
- What is the list of parameters you have data for (can be a general list at this stage)?
- How many years do you have data for?
- Was this data collected following a sampling and analysis plan (SAP) and/or a quality assurance project plan (QAPP)? If so, please be prepared to share those documents.
Acquiring a User ID and Password
After the initial inquiry with MSUEWQ, a username and password will be necessary to upload data to the Data Hub. To create a username for you, we will need:
- Your first and last name
- Email address
- The name of the program the data is associated with
- a short bio describing your role in the program and a photo of yourself to include you’re your profile within the Data Hub (optional).
Once your username is created you will receive an email from MSUEWQ with a link for logging in and creating a password. If you forget your password at any point, send an email to asigler@montana.edu and ExtensionWater@montana.edu and we can help you reset it.
Adding your sites to the Data Hub
Data is uploaded to the Data Hub associated with sites, which are created with basic information about location, stream, watershed, etc. If your data is currently stored in the National Water Quality Portal, MSUEWQ can provide guidance on how to export the site list from the portal for upload to the Data Hub.
To add a new site, email the following site information to Adam Sigler at asigler@montana.edu and ExtensionWater@montana.edu. Site information should be entered to this data site information template.
Attributes required for each site include: site name, site ID, site description, watershed name, stream name, geographic coordinates, and elevation.
Compare your parameter list with current Data Hub Parameter List
Click here to download a file with a list of parameters currently in the Data Hub. Open the file in Excel, highlight the parameters you have data for, and email the file to Adam Sigler and ExtensionWater. Include in the email a list of any parameters you have data for which are not currently in the Data Hub. It may be possible to add your new parameters to the Data Hub. This will require working with MSUEWQ to fill out the Excel file with the relevant information for your parameters.
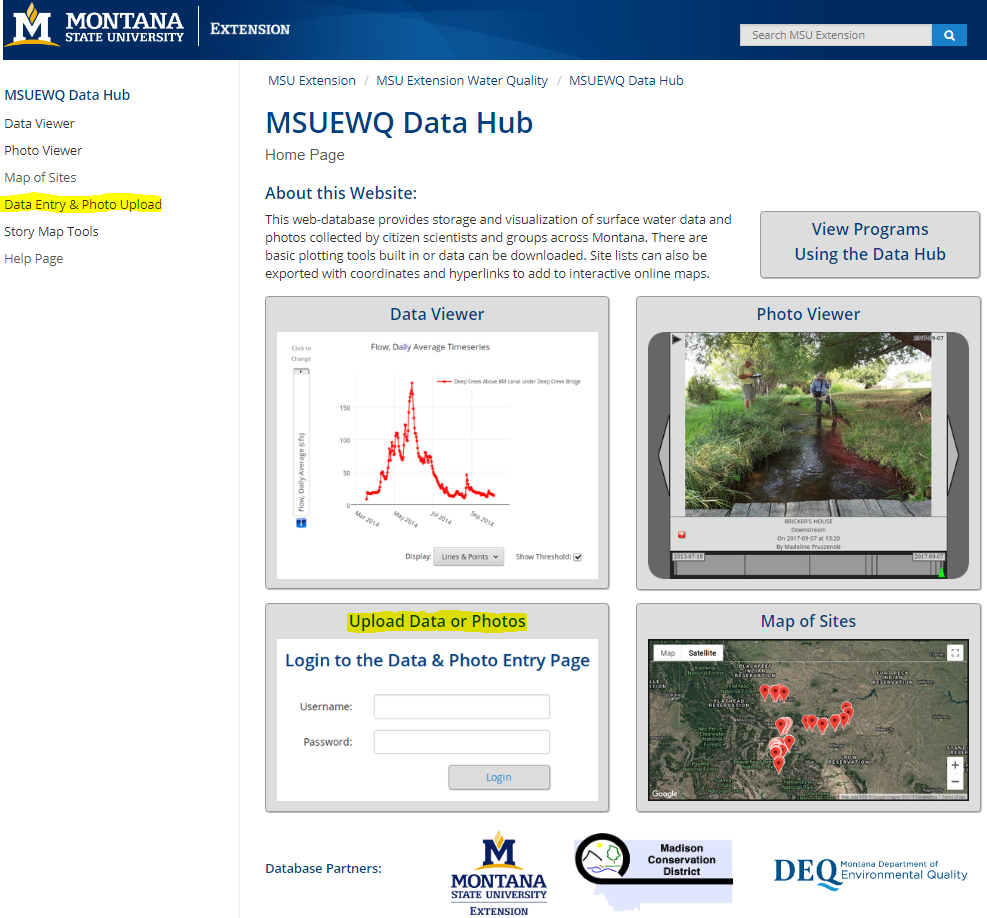
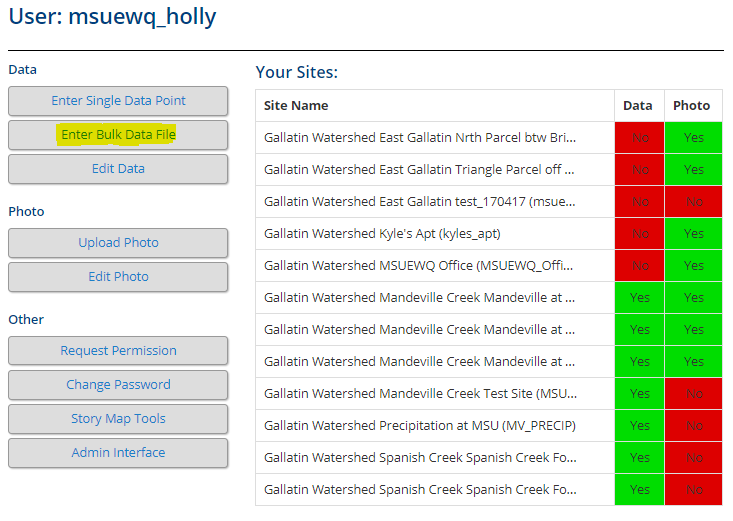
1. Click the “Data Entry and Photo Upload” link at the left-hand side of the page or click the image at the bottom left of the Data Hub homepage.
2. Log in using credentials acquired from Section 2 (above).
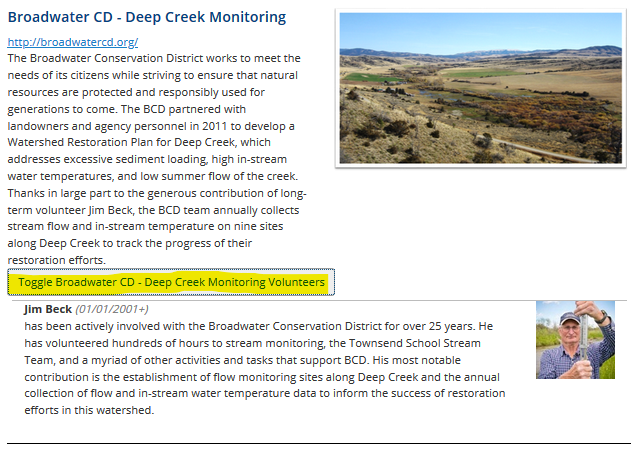
Once you have a username and password update your volunteer profile with a picture and bio. To view some examples of current volunteer bios navigate to the MSUEWQ Data Hub Programs Page and click on the volunteer toggle.Once you have a username and password update your volunteer profile with a picture and bio. To view some examples of current volunteer bios navigate to the MSUEWQ Data Hub Programs Page and click on the volunteer toggle.
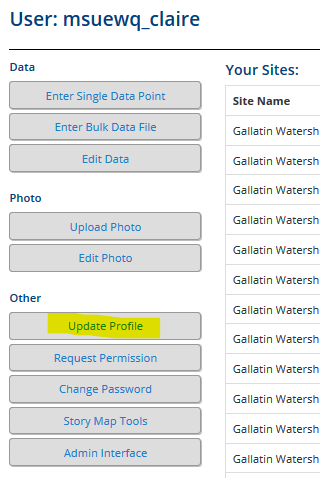
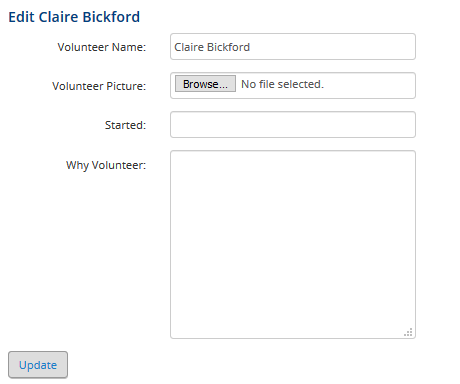
To update your volunteer profile:
- Navigate to the Data Hub portal and login using your Username and Password.
- Select the “Update Profile” button.
- Upload a picture
- Select the date that you started volunteering for your program
- Write a brief bio about yourself and why you volunteer.
- Click “Update”
 |
 |
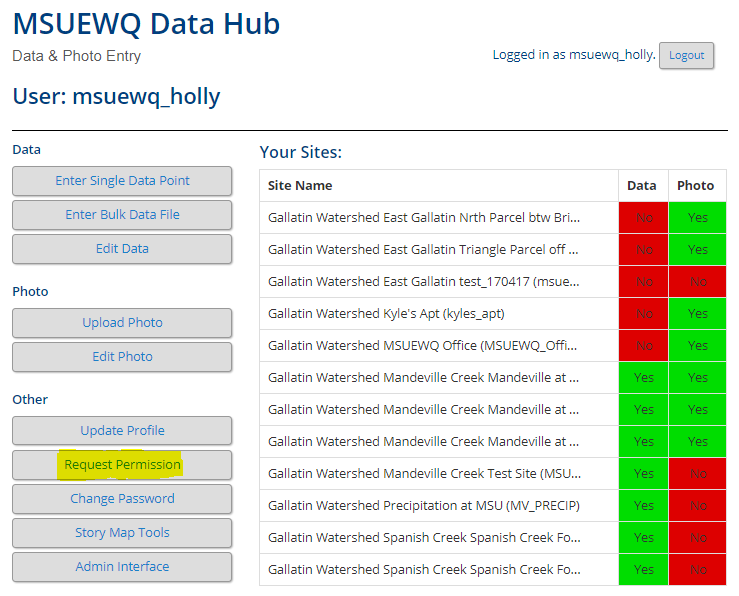
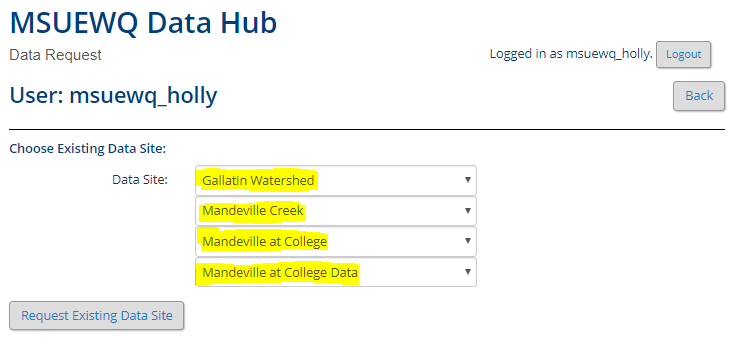
To request permission to add data or photos to an existing site on Data Hub, click the “Request Permission” after logging in. Choose “Data” or “Photo” and select the watershed, stream and site(s) you wish to have access to. After this step is complete, send an email to Adam Sigler and ExtensionWater indicating that your request has been submitted in the Data Hub.
 |
|
|
Photos can be uploaded to Data Hub directly from your Smartphone, eliminating the need to appropriately store and file photos from the field. These instructions can also be used when uploading photos from a computer.
To upload photos:
Navigate to the Data Hub portal and login using your Username and Password.
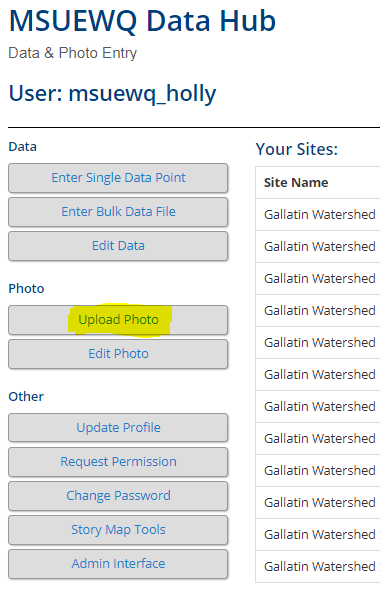 |
- Select “Upload Photo” button.
- Select the Watershed, Stream, Site, and Photo site option. Select “Repeat” option if you are uploading a repeat photopoint of your stream site and “General Photos” for all other pictures at your site. Click “Upload Photo”.
- Select the Date, Time, and Photographer name (Click “You” if you took the photo). Upload the photo, add optional comment, and select your program name. Click “Check Photo.”
- Review to ensure all information is correct and photo is depicted as desired. Click “Yes, Upload It” to add this photo to the Photo Viewer.
The following instructions outline how to fill out the Photo Site Template. Included in the template are examples of various photo site types.
1.To fill out the blue columns in the template you will need to obtain site information from the data hub. Site information can be found by:
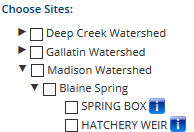
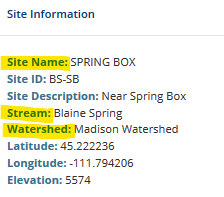
- Navigating to the Data Hub Data Viewer and clicking on the blue “i” next to the site you would like to add photos to.
- This will open a site information box with the following
- Watershed
- Stream name
- Site Name
 |
|
2. To fill out the green columns in the template you will need to specify the Photo Point Type, Photo Point Name, and the Photo Point Description. Definitions for these fields are listed below.
Photo Point Type: can be filled in as General Photo, Exact Repeat Photo, or Administrative photos. See definitions below.
- General Photo: photos taken at a sampling site that are interesting to a general audience. These can be photos of people sampling, an animal in the stream, a source of pollution, a notable weather event, an especially beautiful scene, etc.
General photos can also consist of site photos that are of a consistent orientation (upstream, downstream across) but that don’t have strict guidance for camera placement like exact repeat photos. This may warrant creating a separate general photo site so that these roughly repeated photos can be viewed together.
- Exact Repeat Photo: consist of photos that are taken at the same location, with the exact same camera placement and orientation. They are used to monitor site changes over time and are conducive for viewing as time lapse photography. They often have an SOP with instructions for camera placement.
- Administrative Photos: photos that contain information for administrative record keeping. These photos would not be interesting to a general audience. This can be photos that contain sampling information (location, date, time), photos for keeping track of equipment, photos of data sheets, staff gauges etc.
Photo Point Name: this field includes the orientation (upstream, downstream, etc.) of the photo, if applicable, and the photo site type.
Examples:
- General Photo Point: General Site
- General Photo Point (roughly repeated photo): Across Stream
- Repeat: Across Stream Repeat
- Administrative Photos: Administrative
Photo Point Description: a description of the photo type and location of where photos were taken.
Examples:
- General Photo Point: “general photos from around the site”
- General Photo Point (roughly repeated photo): “Standing on the boulder on river right, facing generally downstream”
- Repeat: “Standing on the boulder on river right, facing downstream. Top of telephone pole is in the top righthand corner of the frame.”
- Administrative Photos: “administrative photos taken at site”
- Navigate to the Data Hub portal and login using your Username and Password.
- Navigate to the Data Hub portal and login using your Username and Password
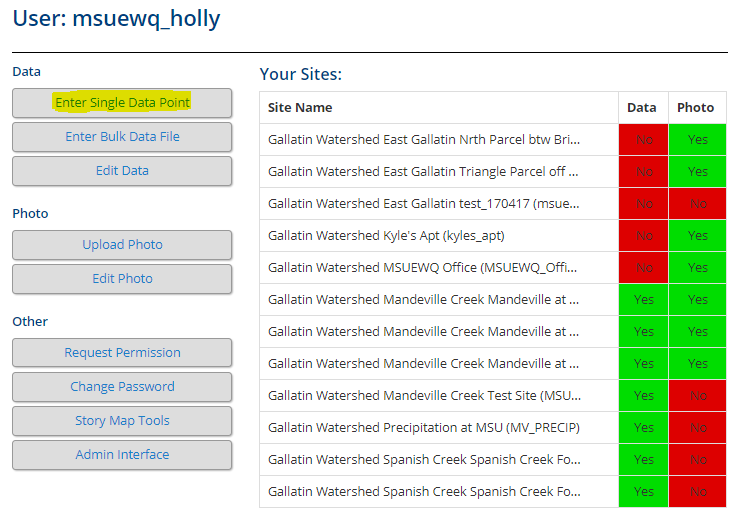
- Select the "Enter Single Data Point" button.
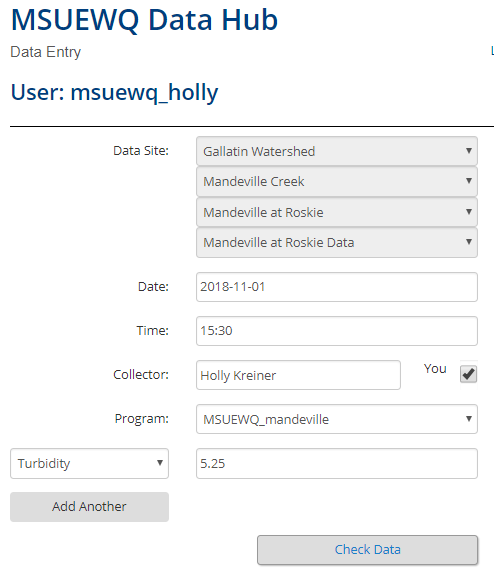
- Watershed, Stream, Site, and Data Site you wish to add data to. Click “Upload Data.”
- Enter the Date, Time (use colon), Collector name (Click “You” if you collected the data).
- Select the “variable” (i.e. parameter) and enter the numeric value associated with that datapoint
- Note: if you are uploading a parameter that hasn’t yet been assigned for this site, request this parameter be added by emailing Adam Sigler at asigler@montana.edu and ExtensionWater@montana.edu
- Select “Check Data” and review your entry. Click “Yes, Upload it” to upload the datapoint.
 |
 |
- The spreadsheet must contain the required columns: site ID, date/time, collector, and data value (details below).
- Only data in the first worksheet within the spreadsheet will be uploaded. However, the entire spreadsheet can be stored in the Data Hub if there is information in additional worksheets that you want stored (metadata).
- The first row of each spreadsheet is assumed to be a header row and is always ignored.
- The order of columns does not matter because you will indicate what each column is during the upload process.
- It is possible to upload a spreadsheet with data from multiple sites and multiple parameters at one time. Data for each parameter must be stored in separate columns.
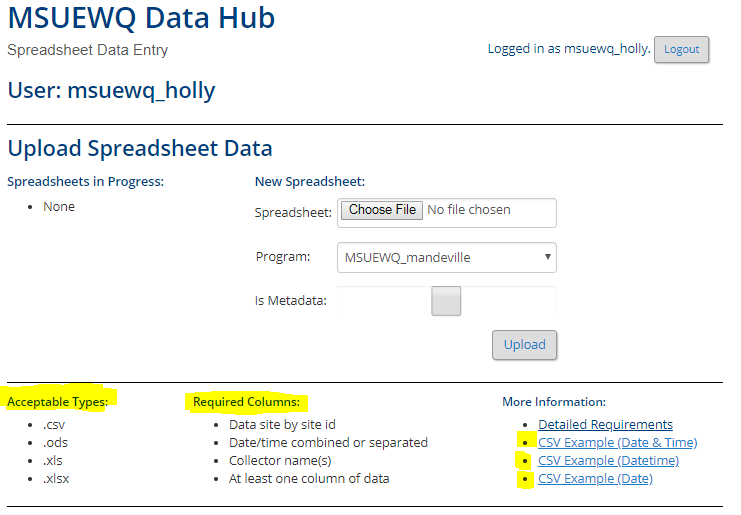
- Acceptable spreadsheet file formats include: Comma Separated Value (.csv); OpenDocument Spreadsheet (.ods); Excel Spreadsheet (.xls); and Excel Microsoft Office Open XML Format Spreadsheet (.xlsx).
Required Spreadsheet Columns
1. Site ID
A Site ID column is required and entries must match site IDs stored in the Data Hub.
2. Date/Time or Date and Time
Date is required and time is optional (set to midnight if not included). Date and time can be included in separate columns, or in a combined ‘Datetime’ column. If using a ‘Date’ and ‘Time’ column, both the dates and times will need to be filled in. If using a ‘Datetime’ column, the time will default to 00:00 if no time is included. Accepted formats:
- Date: YYYY-MM-DD
- Time: hh:mm
- Datetime: YYYY-MM-DDThh:mm
3. Collector
The collector is the person who collected the data. This column is required but can be left blank. If there is more than one name, separate them with a comma. Examples:
- “”
- “John Doe”
- “John Doe, Jane Doe”
4. Data values for at least one parameter
Spreadsheets must include at least one row of data for at least one parameter. Values for each parameter should be in a single column. Ensure that the units for your data (mg/L, NTU, degrees C, etc.) match the units for the variable you are uploading to. Circumstances where missing values are acceptable include:
- A blank data cell is completely ignored
- A ‘NULL’ value will be saved as NULL
- A ‘ND’ value will be stored as Not Detected
Instructions for entering bulk data:
Instructions for entering bulk data:
1. Navigate to the Data Hub portal using your login
 |
 |
 |
2. Select the “Enter Bulk Data” button.
3. Before selecting the file you wish to upload, review that the file is in an acceptable format and that the required columns are included in the correct sequence. Click on the spreadsheet examples under “More Information” to ensure your spreadsheet is in the correct form
4. Click “Choose File” and select the file you wish to upload. Choose your program and select Metadata if you want the entire spreadsheet to be saved in the Data Hub (see below)
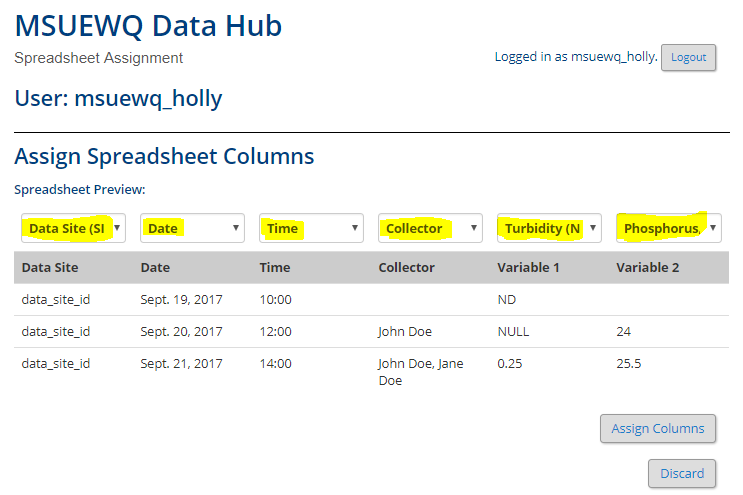
5. Assign spreadsheet columns by clicking the drop-downs for each column and making the appropriate selection for each. Click “Assign Columns."
6. Review column selection and click “Upload Data” button.
*** The Metadata option is typically used if there are multiple worksheets which contain corrections made to the data or rating curves etc. Any information about the data that might help a user understand where the data came from and the quality of the data is good to include in a metadata file. ***
1. Navigate to the Data Hub portal and log in.
2. Select “Story Map Tools”.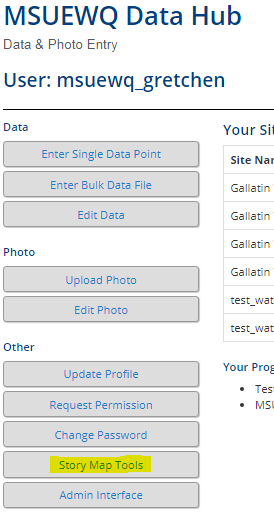
3. Select the sites(s) you want to download data for, check the boxes for data and/or photo popups (if desired), and click “Generate CSV”.
4. The downloaded .csv file will not contain water quality data, but will have lat/long fields that allow you to upload the file to an ArcOnline (or Story Maps) map. If the popup boxes were selected, the file will also have fields with urls to view the data and photos.
- Here is an example map created with data from the Data Hub. Click on the data points to view the site descriptions. Notice the links to view the data and photos in the Data Hub.