Program Participation and Results Summaries
Well Educated Participation Summary
The Well Educated Program has been in place since 2005, and has since reached over 9,500 participants. A program summary report including results from a survey of 2021 program participants is available here.
The Well Educated Program reaches hundreds of participants per year.

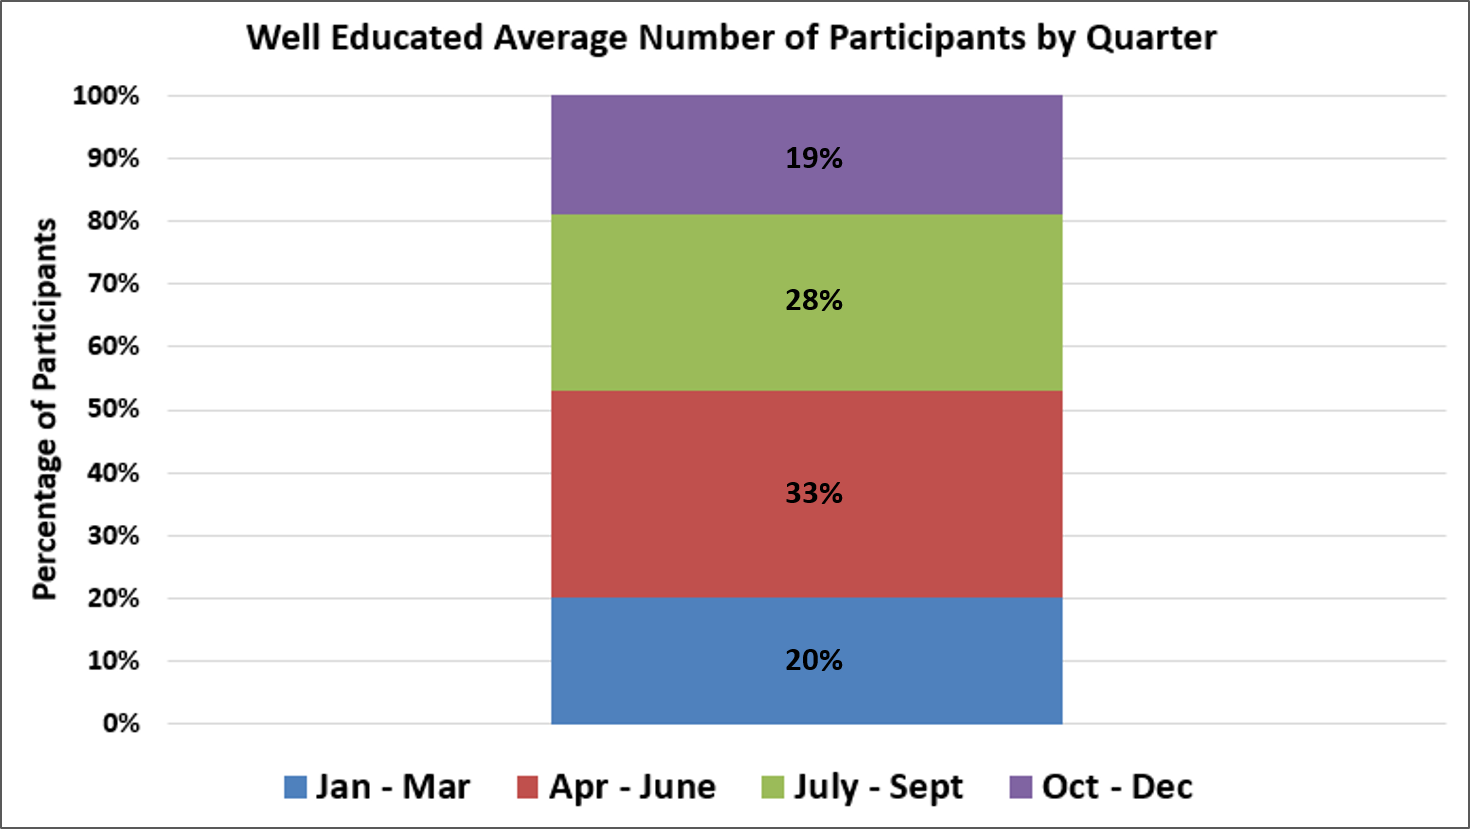
Over the years 2010 - 2018, on average most participants (33%) tested during the months of April, May, and June. This time period coincides with spring snowmelt and runoff. The next most common testing period was during the months of July, August, and September.
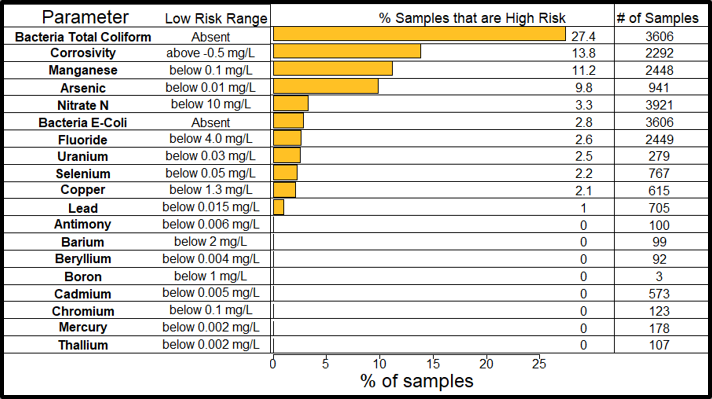
Summary of human health related results 2015-2020

