
Sun River Nutrient Data Summary
W. Adam Sigler
Water Quality Specialist
MSU Extension Water Quality
December 12th 2019
Download this webpage as a PDF here
Table of Contents
Acknowledgements
The following analysis was conducted by MSU Extension Water Quality (MSUEWQ) with funding support from the Montana Department of Environmental Quality (MDEQ) and with statistical assistance from Jennifer Weeding with Treasure State Analytics. Data was collected by the Sun River Watershed group, coordinated by Alan Rollo with field work conducted by Rai Hahn and students of Fairfield High School. Short bios for Alan and Rai are available on the MSUEWQ programs page.
Analysis Summary
Water quality data used in this analysis were collected according to the specifications in the Sun River Quality Assurance Project Plan (Sigler, et al. 2012) and subsequent sampling and analysis plans. All data included in this analysis are available through the MSUEWQ Data Hub (MSUEWQ, 2019). This data was emailed to Sigler by Alan Rollo in May of 2017 and was formatted by Sigler for entry into the MSUEWQ Data Hub (file names in Appendix 1).
Concentration summaries organized by nutrient are presented in the section titled “Nutrient Boxplots and Summaries.” Tables with accompanying summary statistics are presented on the following page in the “Nutrient Summary Tables” section. MDEQ nutrients standards for Total Nitrogen (TN) and Total Phosphorus (TP) for the Northwest Glaciated Plains (Appendix 3), where study sites are located, are included reference but a detailed assessment of concentrations exceeding the threshold was not conducted.
Analysis of concentrations and trends over time are organized by site and by nutrient parameter in sections named for each site followed by the word “Summary.” Initial assessment of the data revealed relatively consistent seasonal patterns in concentrations for most site/nutrient combinations (Appendix 2). This means that a lot of the variability in nutrient concentration across time is related to conditions associated with season. This means that accounting for season of data collection in analysis could result in more robust statistics. Data was divided into three seasons for analysis based on three dates described below and trends were assessed individually for each season at each site for each nutrient parameter.
High flow – Starting on May 1 based on an inflection point in the median daily discharge at the USGS gage on the Sun River near Great Falls (Appendix 3).
Growing season – Starting on June 16th, which is the first date of the year that the MDEQ nutrient criteria for wadable streams apply for the sites on the Sun and tributaries, which fall within the Northwest Glaciated Plains ecoregion. Growing season ends on September 30th, which is the last day that the MDEQ nutrient standards for wadable streams apply (Appendix 4).
Base flow – is the period from October 1 to April 30 that is not high flow or growing season based on the definitions above.
Trend analysis was conducted using linear regression of nutrient concentration versus date, with accounting for season based on the date ranges above. Slope and p values are included for each site, for each parameter, for each season. The slope is the change in concentration (mg/L or ppm) per year. Lines are drawn on the plots if an increasing or decreasing trend is statistically significant, using a p value threshold of 0.1 (alpha value). This means that if there is a line on
Table 1. Site IDs, Names, Coordinates.
| # |
Site ID 2017 SAP |
Site Name 2017 SAP |
Site ID 2012 QAPP |
Latitude | Longitude |
| 1 | SUN-SUNR50 | Sun River near Augusta | SR-AG | 47.547861 | -112.366250 |
| 2 | SUN-DUCKC01 | Big Coulee near Simms | BC-SM | 47.516972 | -111.887306 |
| 3 | SUN-ADBEC01 | Adobe Creek near Ft Shaw | AC-200 | 47.510583 | -111.800611 |
| 4 | SUN-MILCU01 | Mill Coulee near Sun River | ML-200 | 47.540611 | -111.705806 |
| 5 | SUN-MUDYC57 | Muddy Creek at Vaughn | MC-VHN | 47.561056 | -111.538306 |
| 6 | SUN-SUNR56 | Sun River at Great Falls | SR-GF | 47.492028 | -111.334361 |
Results
Nitrate Summary
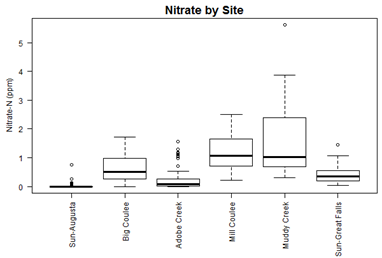
- At the most upstream site (Augusta), most (58/76) of the nitrate concentrations are below detection (0.01 ppm).
- The highest observed nitrate concentrations are on Muddy Creek.
- Both the Muddy Creek and Mill Coulee sites consistently have the highest nitrate concentrations (median around 1 ppm).
- There is not an aquatic life standard for nitrate in Montana. The drinking water standard for nitrate is 10 ppm.
Total Nitrogen Summary
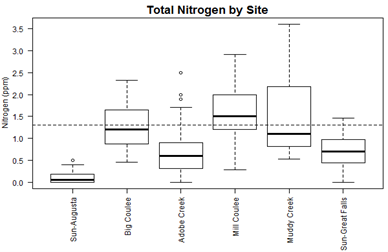
- At the most upstream site (Augusta), almost half (26/58) of the total nitrogen concentrations are below detection (0.05 ppm).
- Big Coulee, Mill Coulee, and Muddy Creek regularly have total nitrogen concentrations above the total nitrogen standard of 1.3 ppm for the Northwest Glaciated Plains wadeable streams, but it is important to note that the standard only applies between June 16thand September 30th.
Total Phosphorus Summary
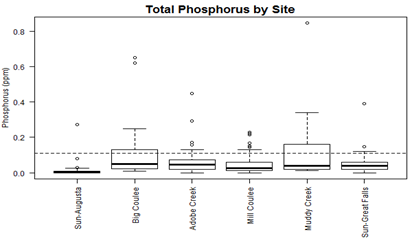
- For all of the sites, most of the total phosphorus concentrations are below the 0.11 ppm standard for the Northwest Glaciated Plains wadeable streams, which apply between June 16th and September 30th.
Nutrient Summary Tables
| Site | # | #ND | Min | Avg | Med | Max | Trends |
|---|---|---|---|---|---|---|---|
| Sun- Augusta | 76 | 58 | ND | 0.02 | ND |
0.76 |
|
| Big Coulee | 58 | 1 | ND | 064 | 0.50 | 1.72 | |
| Adobe Creek | 65 | 13 | ND | 0.26 | 0.08 | 1.56 | |
| Mill Coulee | 60 | 0 | 0.21 | 1.18 | 1.07 | 2.51 | |
| Muddy Creek | 82 | 0 | 0.31 | 1.55 | 1.02 | 5.61 | |
| Sun-Great Falls | 79 | 0 | 0.03 | 0.43 | 0.36 | 1.45 |
Grow ↓ |
| Site | # | #ND | Min | Avg | Med | Max | Trends |
|---|---|---|---|---|---|---|---|
| Sun- Augusta | 58 | 26 | ND | 0.10 | 0.06 | 0.50 | |
| Big Coulee | 51 | 0 | 0.46 | 1.25 | 1.20 | 2.33 |
Grow↓ High ↓ |
| Adobe Creek | 63 | 8 | ND | 0.71 | 0.60 | 2.50 | |
| Mill Coulee | 54 | 0 | 0.29 | 1.56 | 1.50 | 2.91 | |
| Muddy Creek | 23 | 0 | 0.53 | 1.5 | 1.10 | 3.60 | |
| Sun-Great Falls | 63 | 5 | ND | 0.69 | 0.70 | 1.46 |
Grow↓ |
| Site | # | #ND | Min | Avg | Med | Max | Trends |
|---|---|---|---|---|---|---|---|
| Sun- Augusta |
74 |
22 | ND | 0.01 | ND | 0.27 | |
| Big Coulee | 60 | 0 | 0.01 | 0.10 | 0.05 | 0.65 | Grow↓ |
| Adobe Creek | 65 | 1 | ND | 0.06 | 0.05 | 0.45 | Grow↓ High↓ |
| Mill Coulee | 59 | 3 | ND | 0.05 | 0.03 | 0.23 |
|
| Muddy Creek | 29 | 0 | 0.01 | 0.11 | 0.04 | 0.85 | |
| Sun-Great Falls | 78 | 1 | ND | 0.05 | 0.04 | 0.39 |
Grow↓ Base↓ |
Sun near Augusta
Nitrate
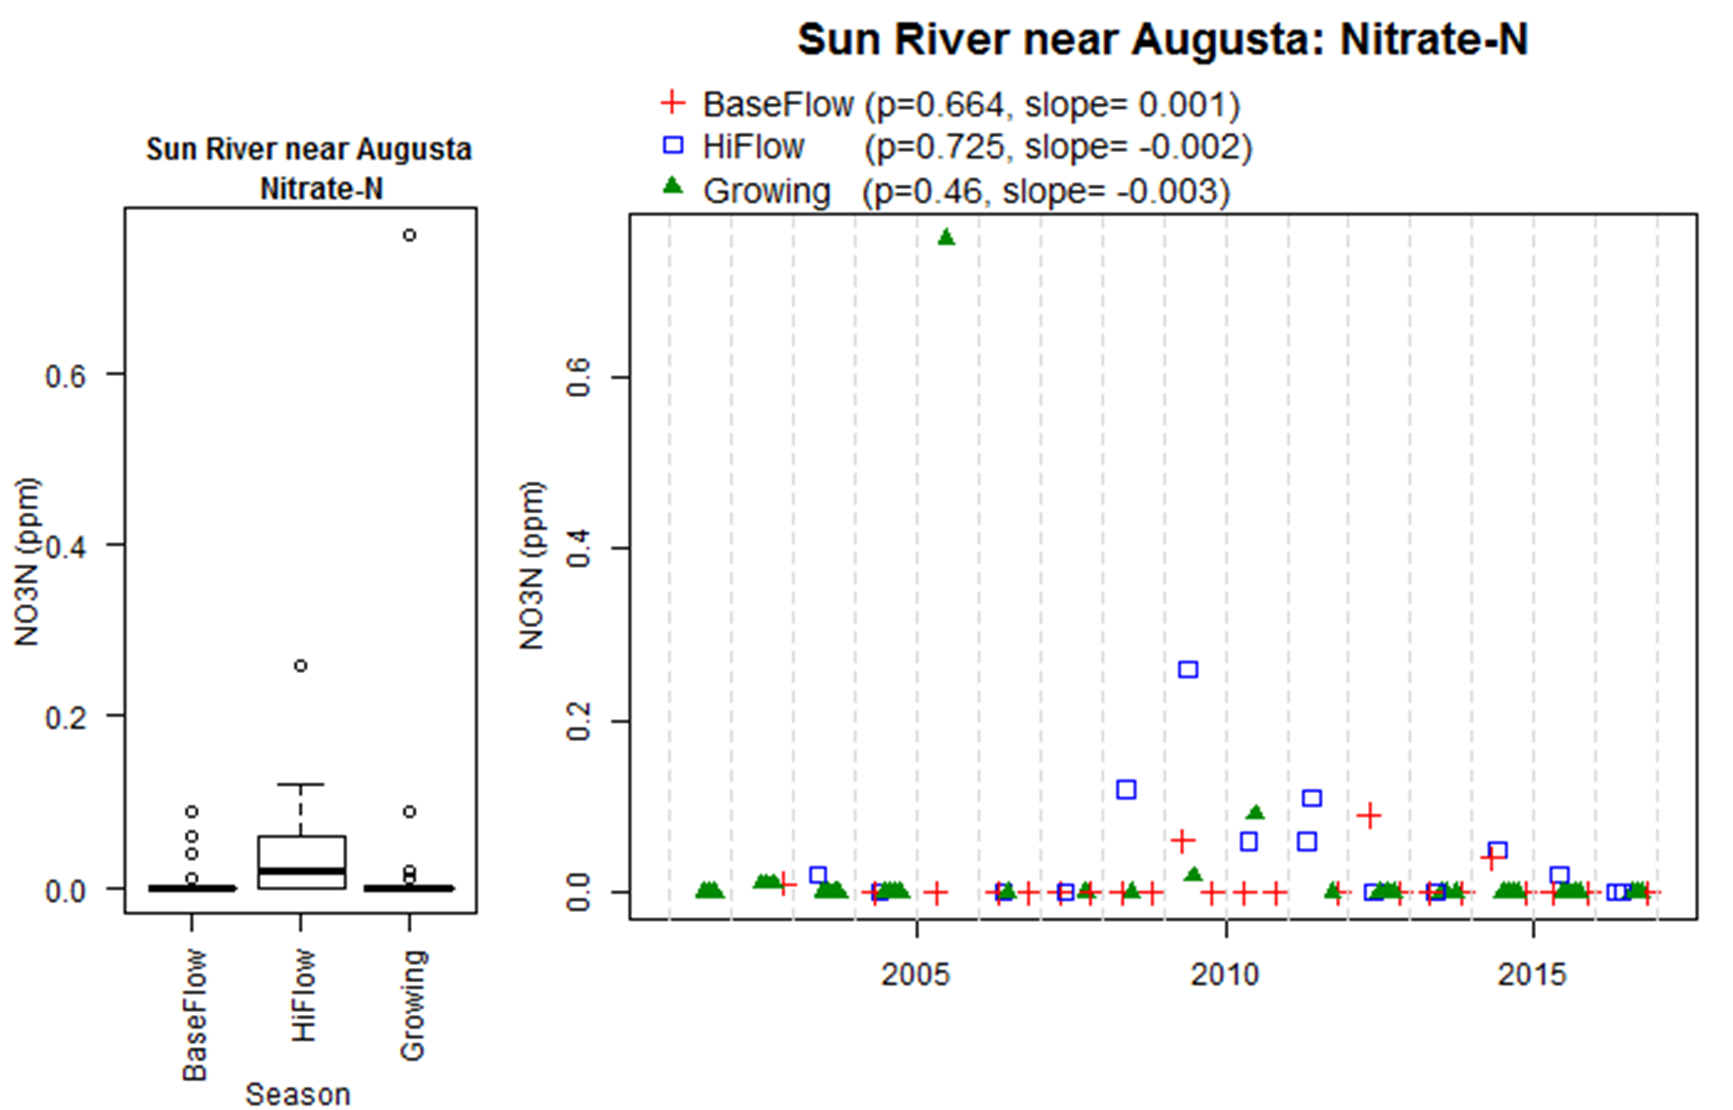
Nitrate concentrations are relatively consistent across seasons, with the highest concentrations detected during high flow.
The high number of samples below the detection limit (58/76) make it impossible to statistically assess the trend in nitrate concentration over time at this site.
Total Nitrogen
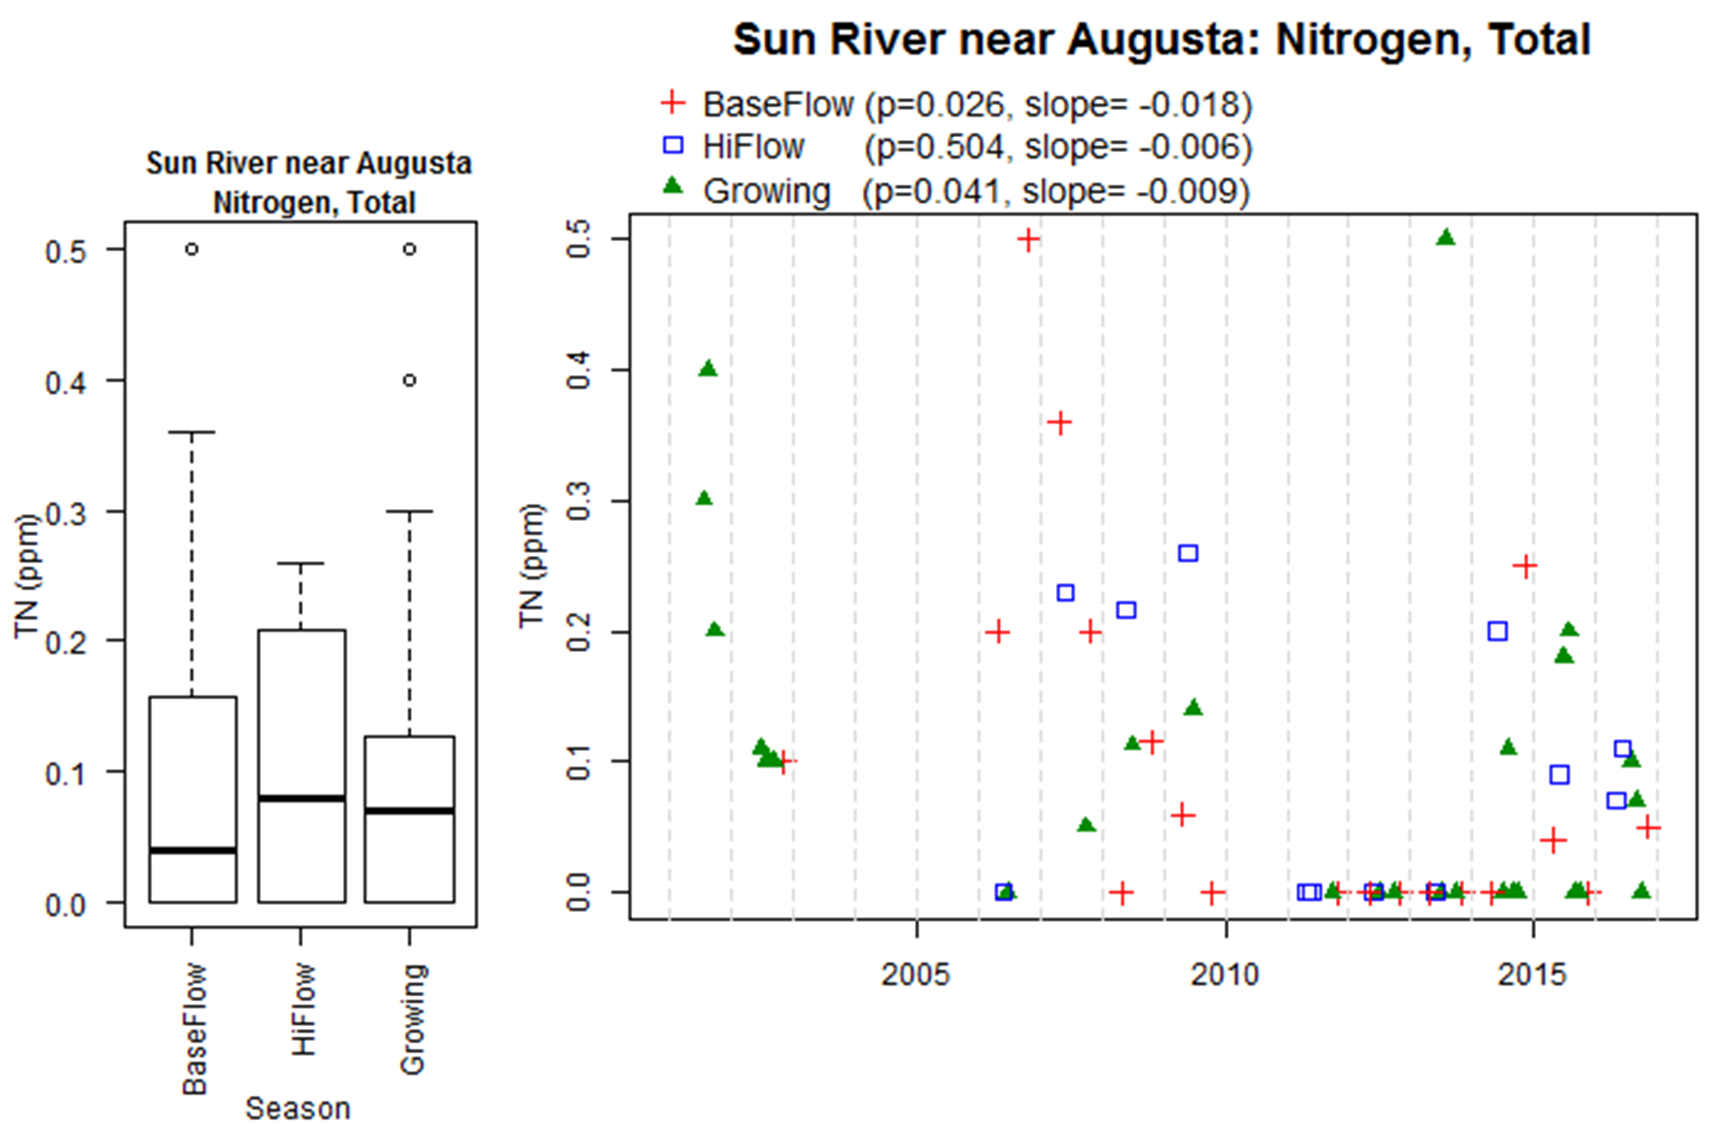
Total nitrogen is relatively consistent across seasons.
The high number of samples below the detection limit (26/58) make it challenging to statistically assess the trend in total nitrogen concentration over time at this site. High numbers of non-detects are the reason that no significance is indicated during the growing season even though the p value is less than 0.1.
Total Phosphorus
Total phosphorus is relatively consistent across seasons.
The high number of samples below the detection limit (22/74) make it challenging to statistically assess the trend in total phosphorus concentration over time at this site.
Big Coulee
Nitrate
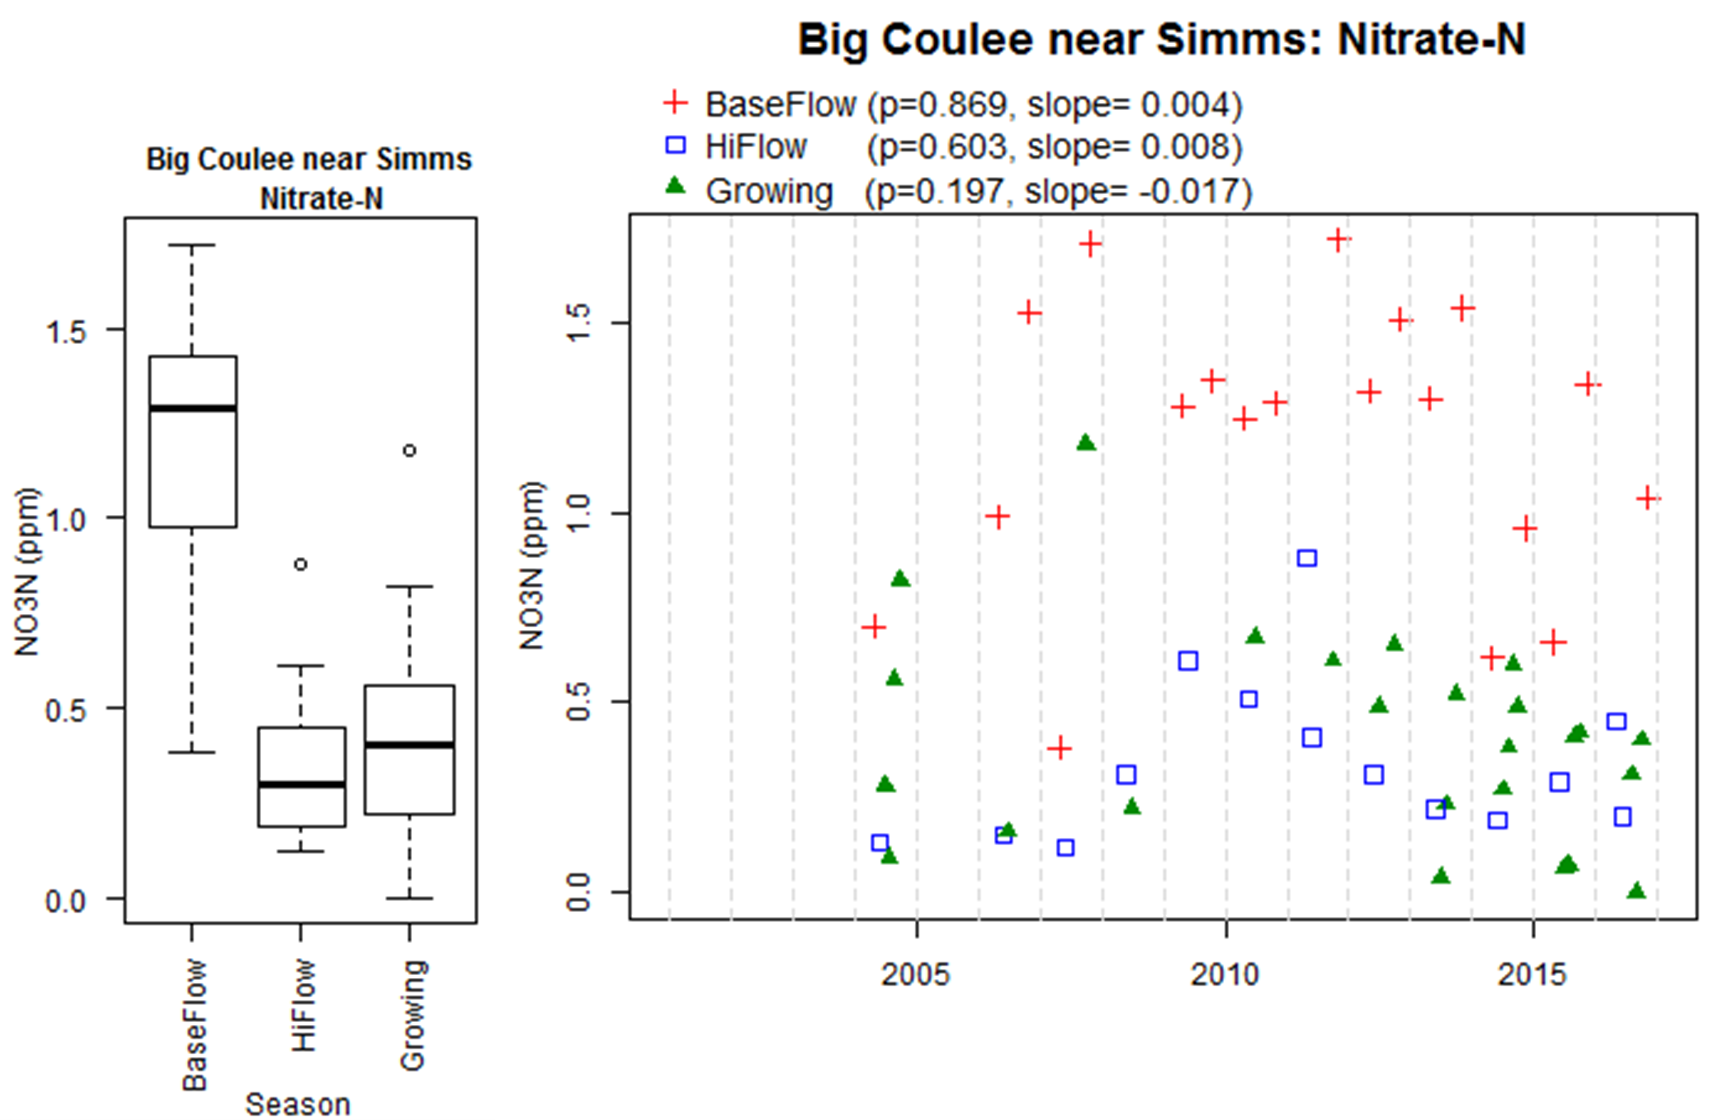
Nitrate concentrations are highest during baseflow at this site.
There are no significant trends in nitrate concentration over time at this site.
Total Nitrogen
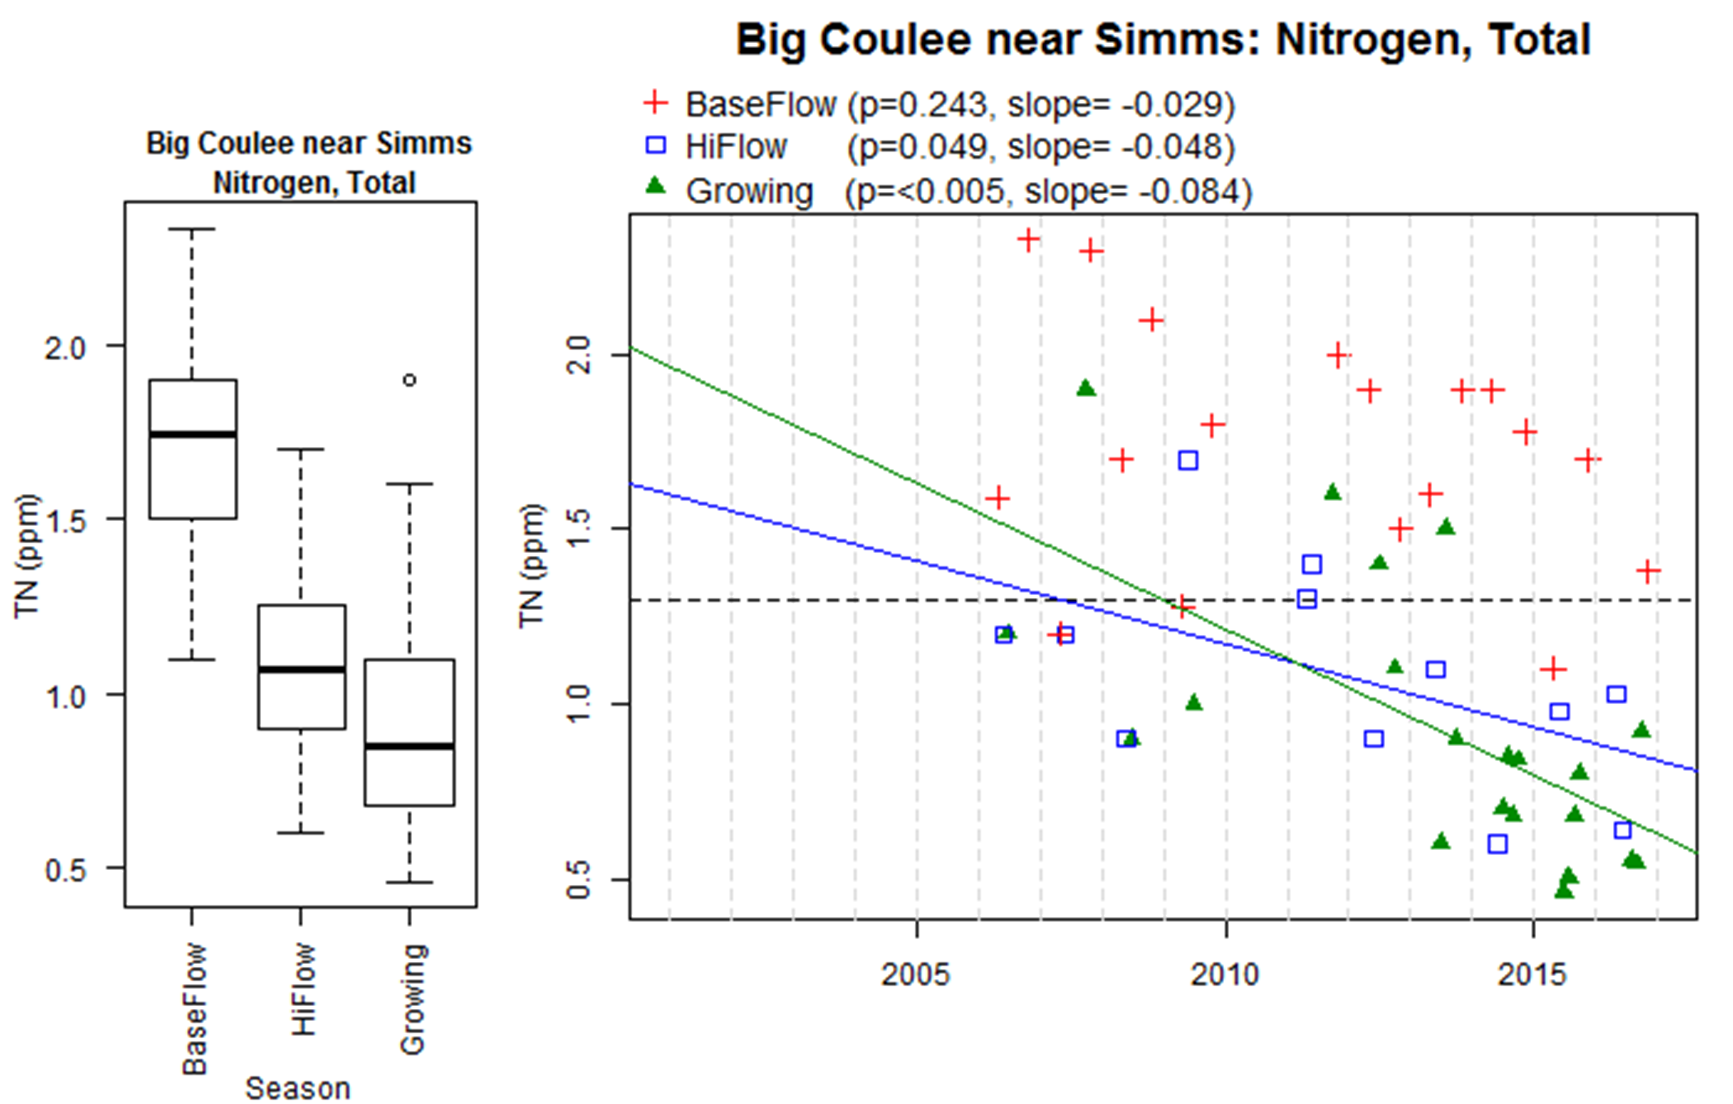
Total nitrogen concentrations are highest during baseflow and are primarily attributed to nitrate.
Over the sampling period, there is a statistically significant decrease in total nitrogen concentration during high flow of 0.048 ppm per year and a decrease during the growing season of 0.084 ppm per year.
Total Phosphorus
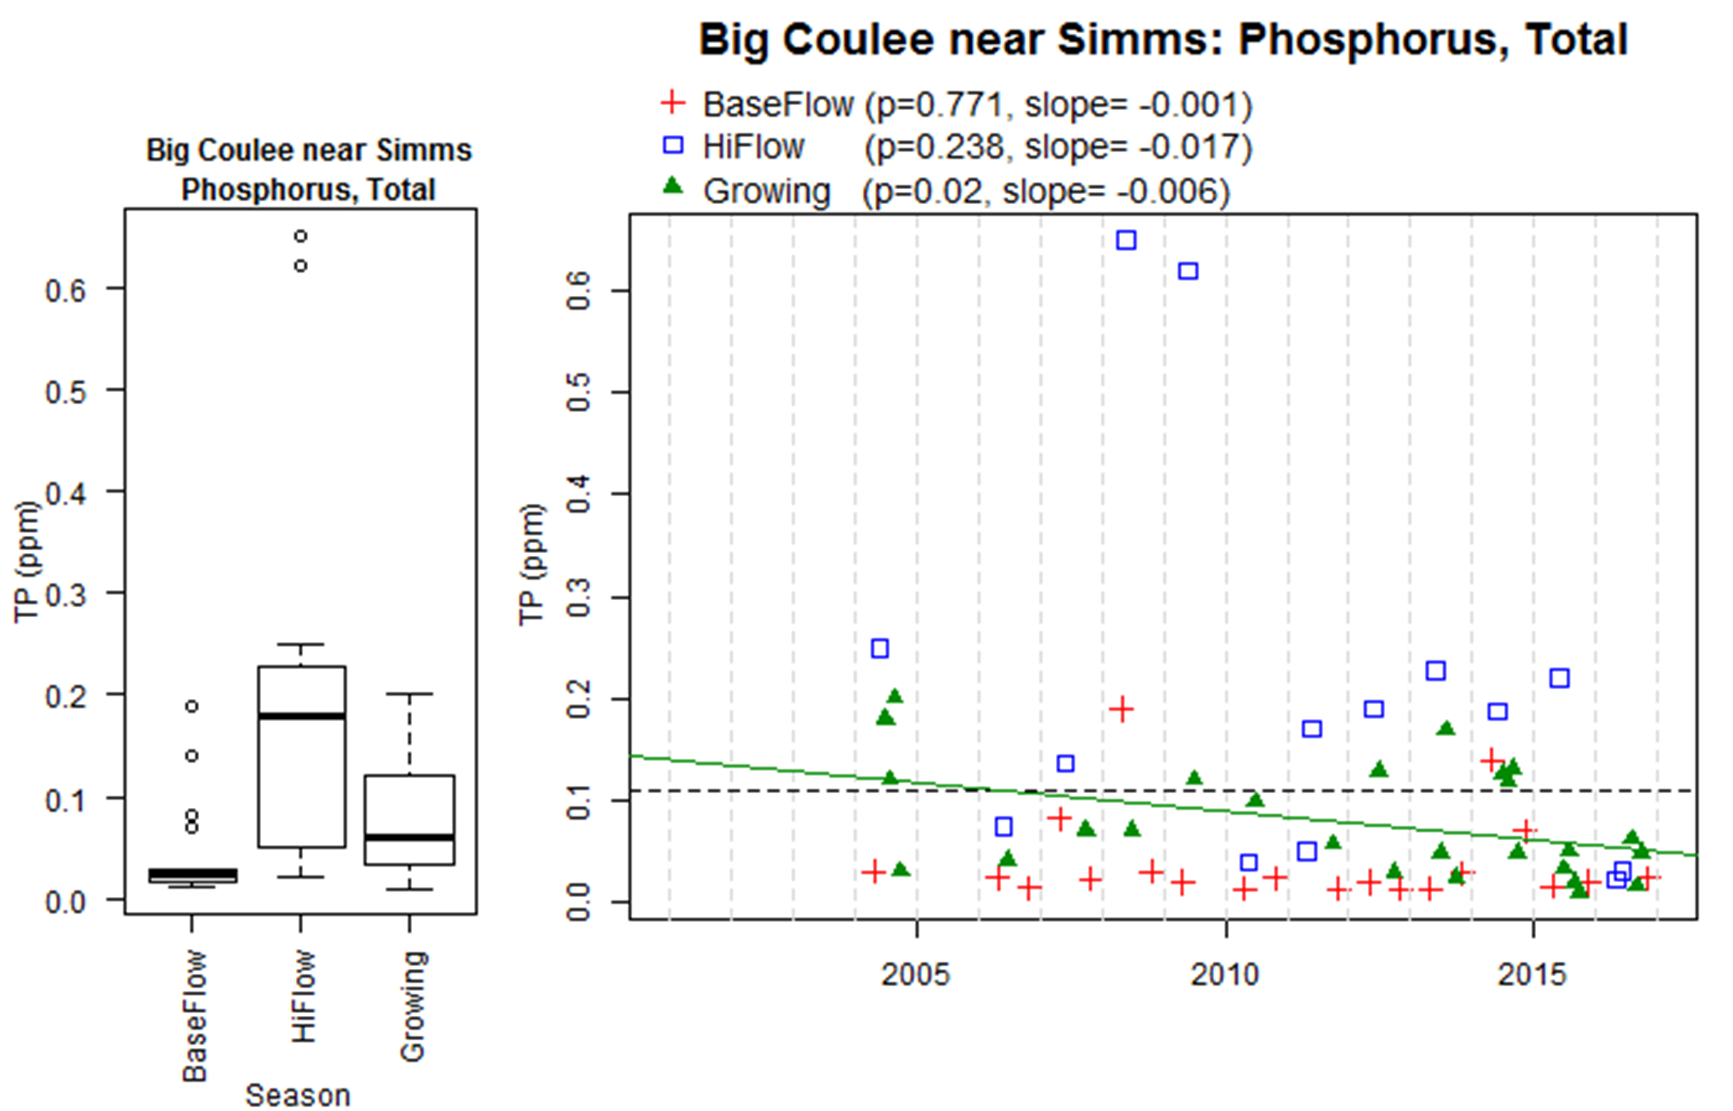
Total phosphorus concentrations are highest during high flow.
Over the sampling period, there is a statistically significant decrease in total phosphorus concentration during the growing season of 0.006 ppm per year.
Adobe Creek
Nitrate
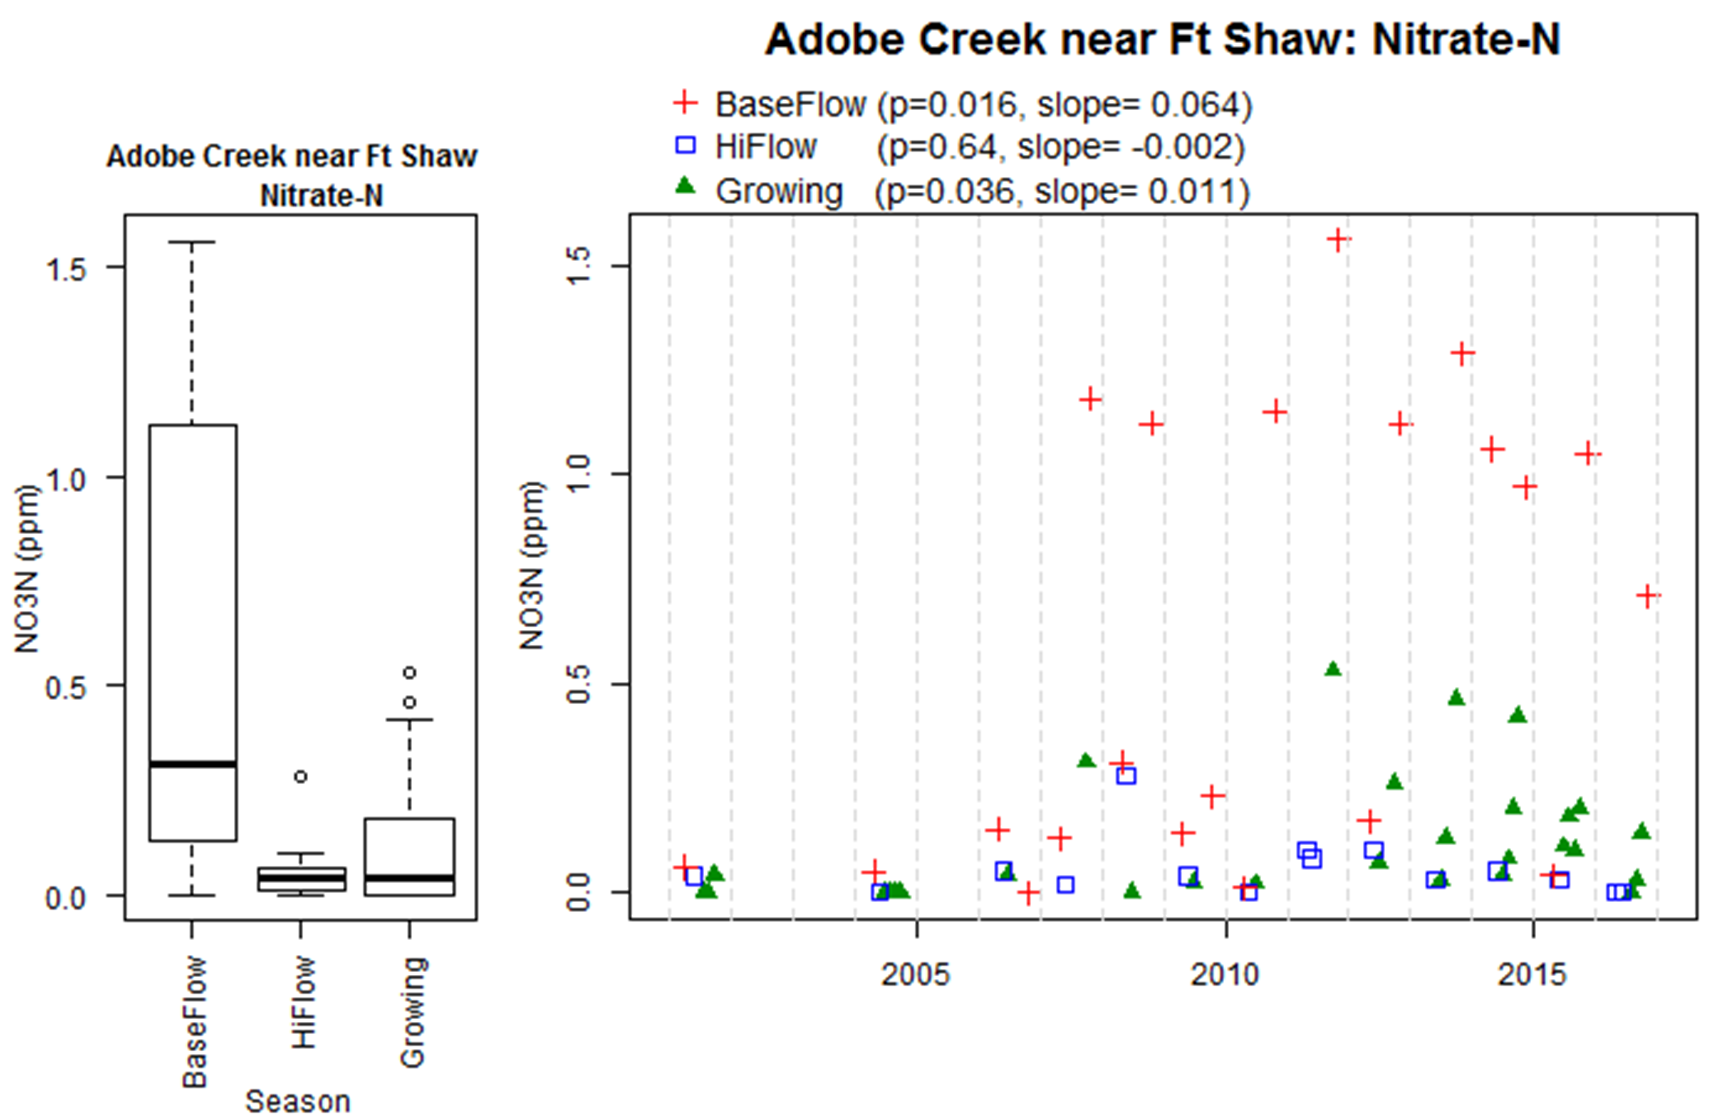
Nitrate concentrations are highest during baseflow at this site.
There are no significant trends in nitrate concentration over time at this site.
There is a pattern of higher nitrate concentrations during some portions of baseflow and not others, which is worth further assessment.
Total Nitrogen
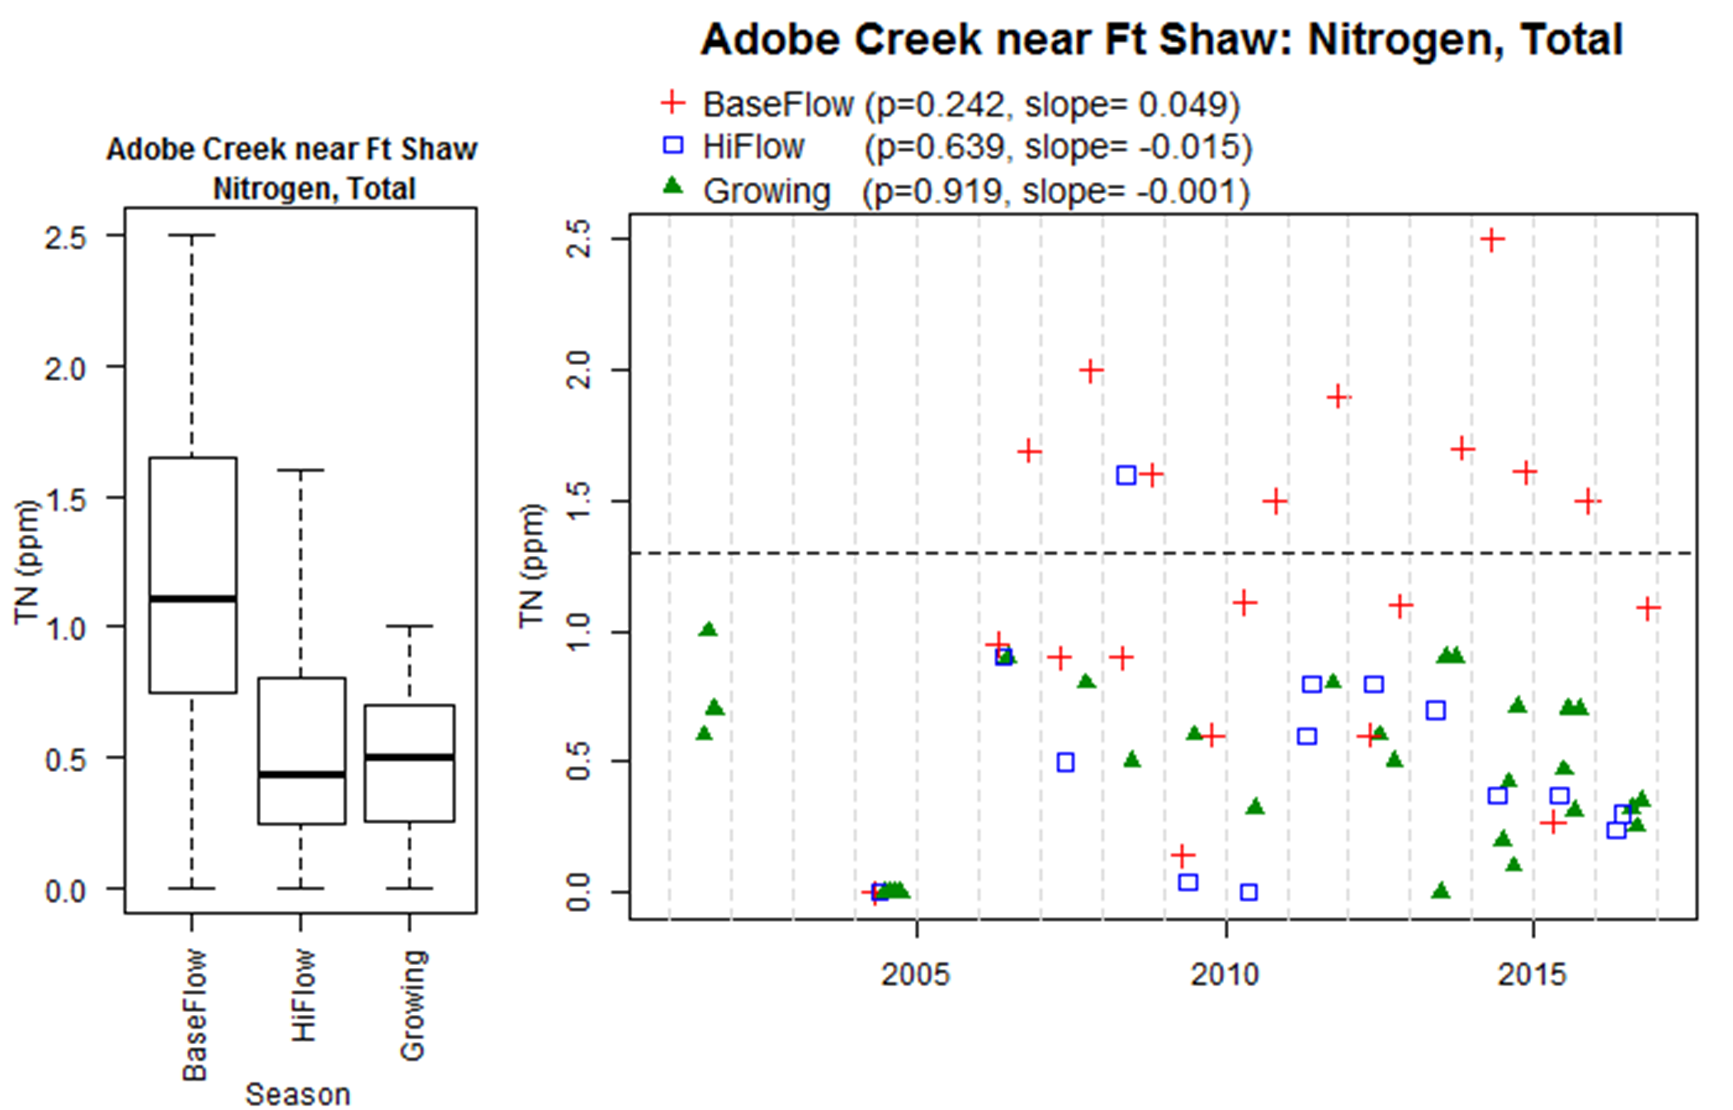
Total nitrogen concentrations are highest during baseflow and are largely attributed to nitrate.
There are no significant trends in total nitrogen concentration over time at this site.
Total Phosphorus
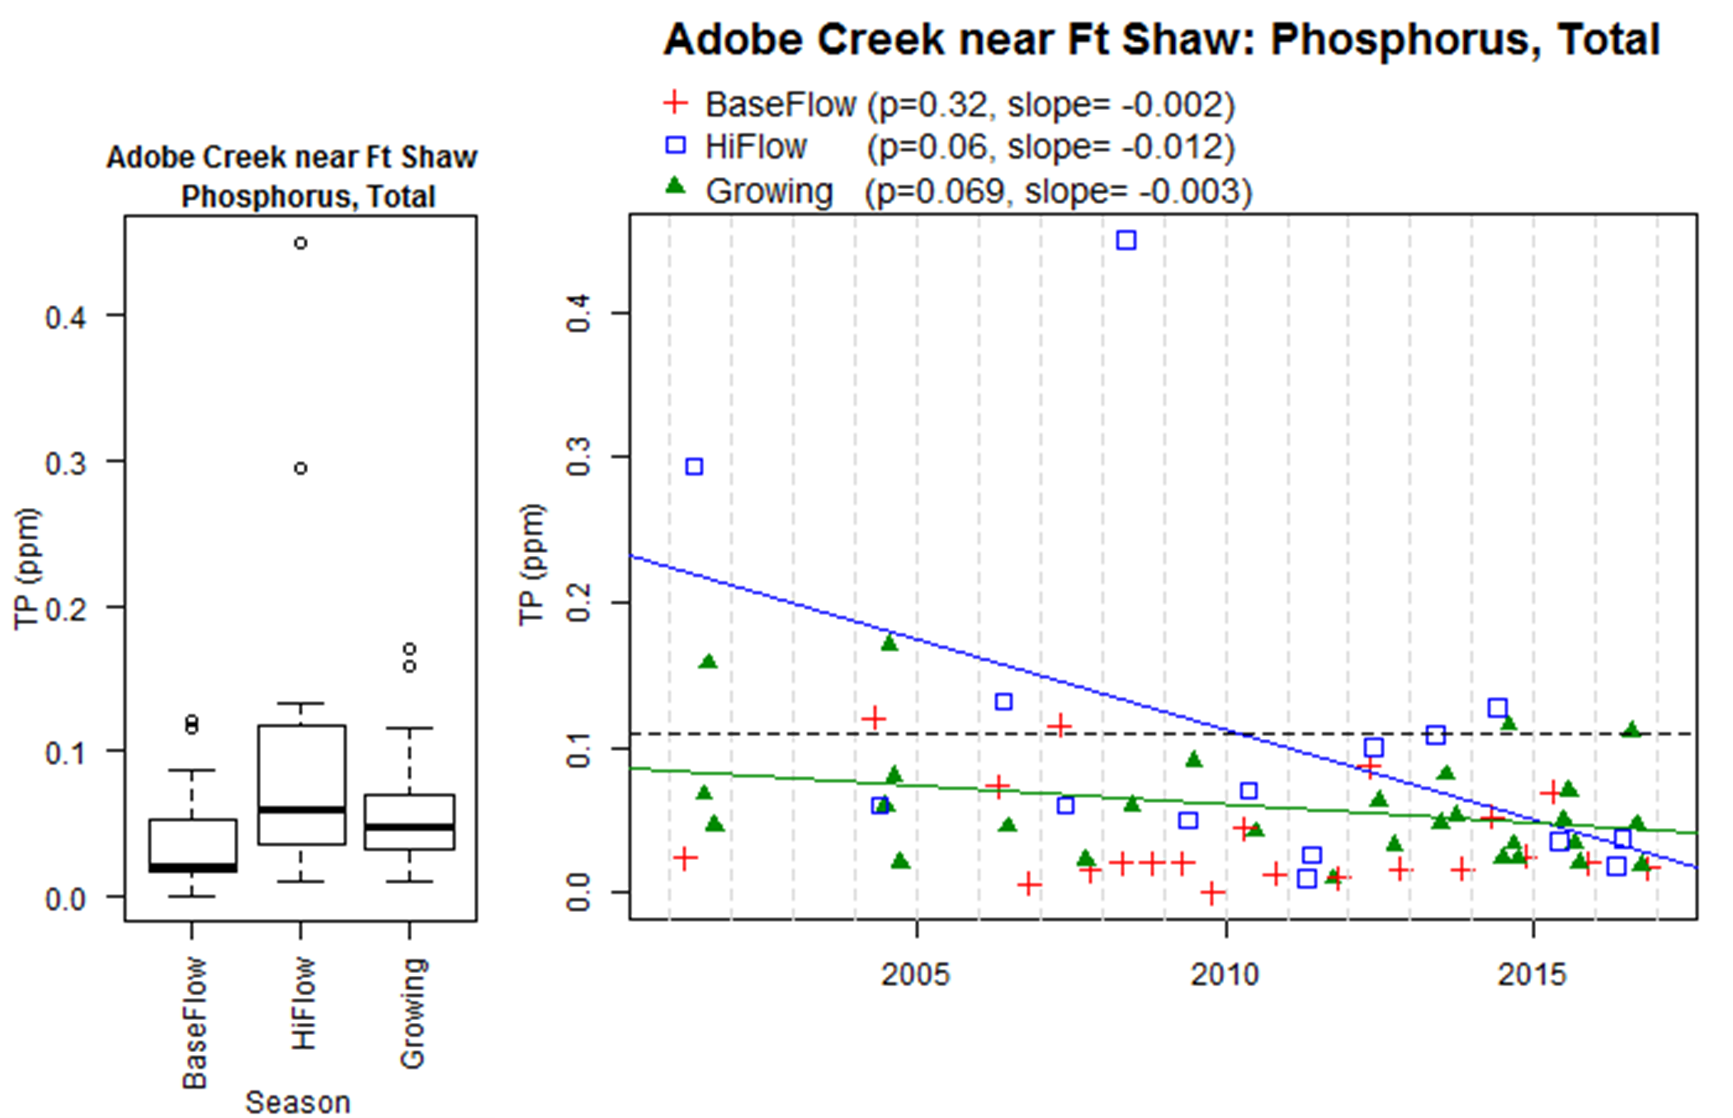
Total phosphorus concentrations are highest during high flow.
Over the sampling period, there is a statistically significant decrease in total phosphorus concentration during high flow of 0.012 ppm per year and during the growing season of 0.003 ppm per year.
Mill Coulee
Nitrate
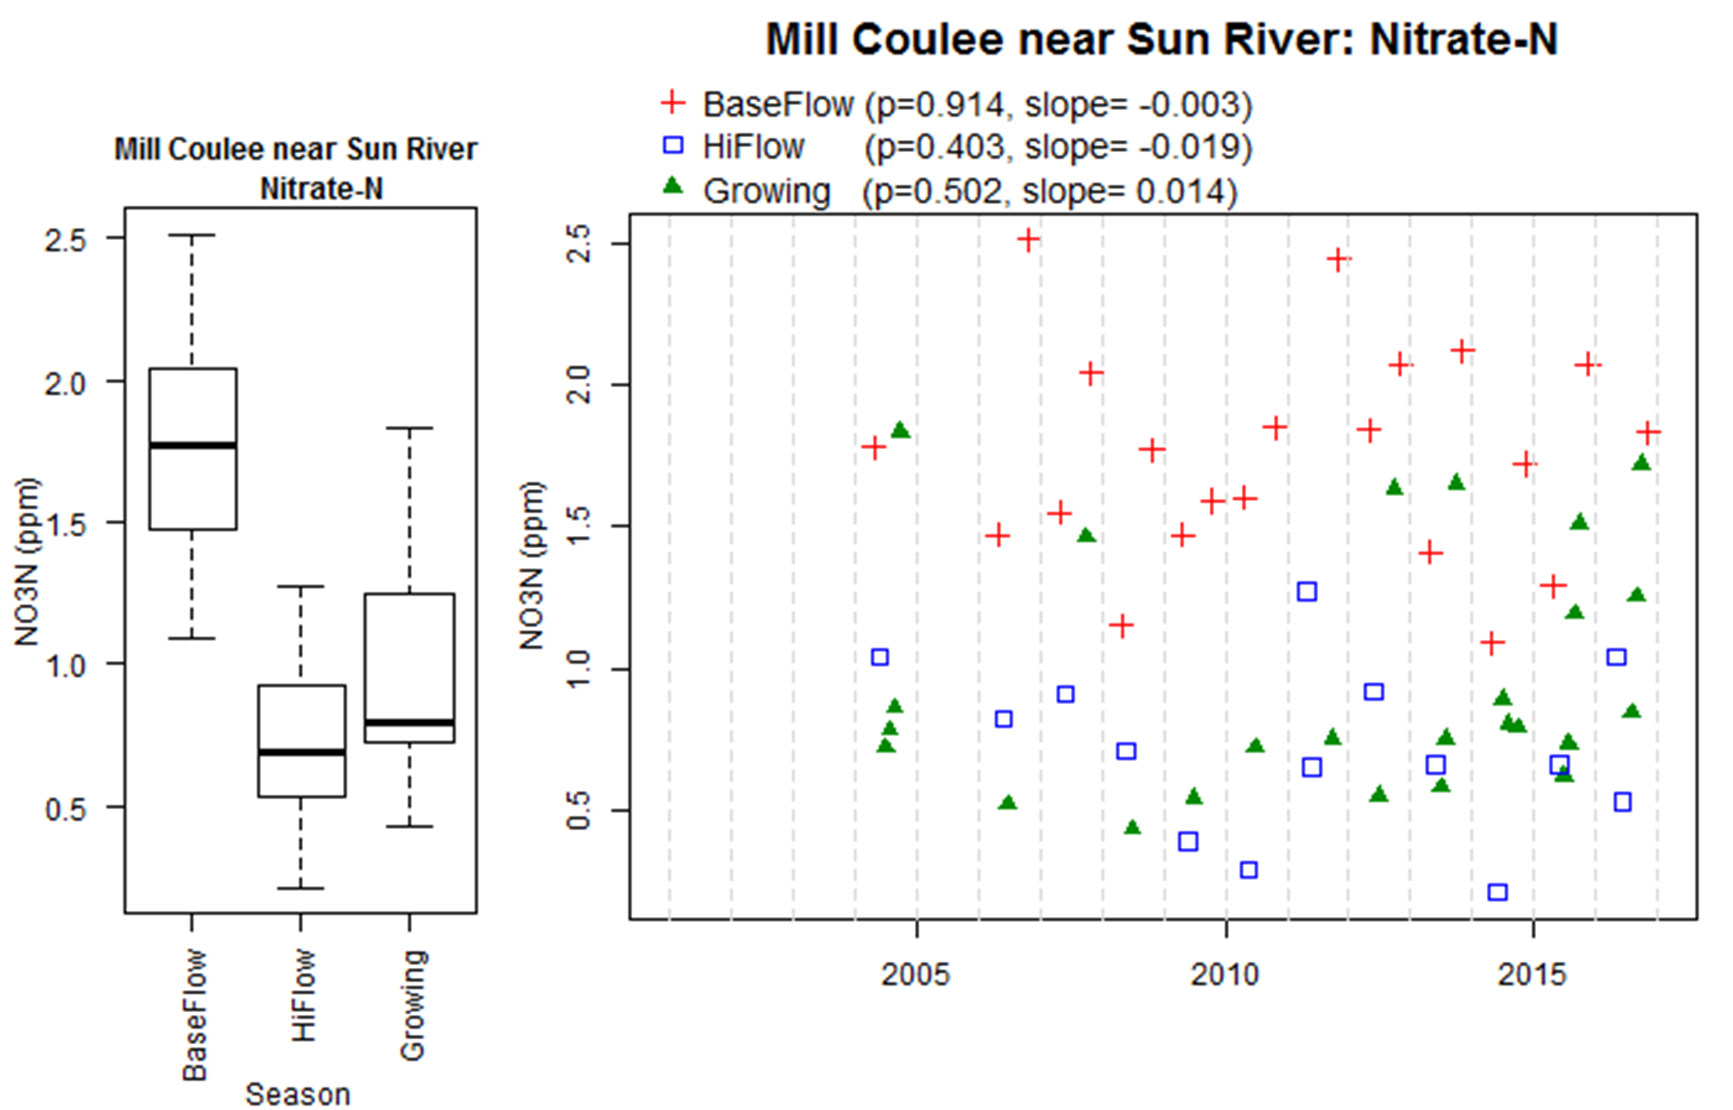
Nitrate concentrations are highest during baseflow at this site.
There are no significant trends in nitrate concentration over time at this site.
Total Nitrogen
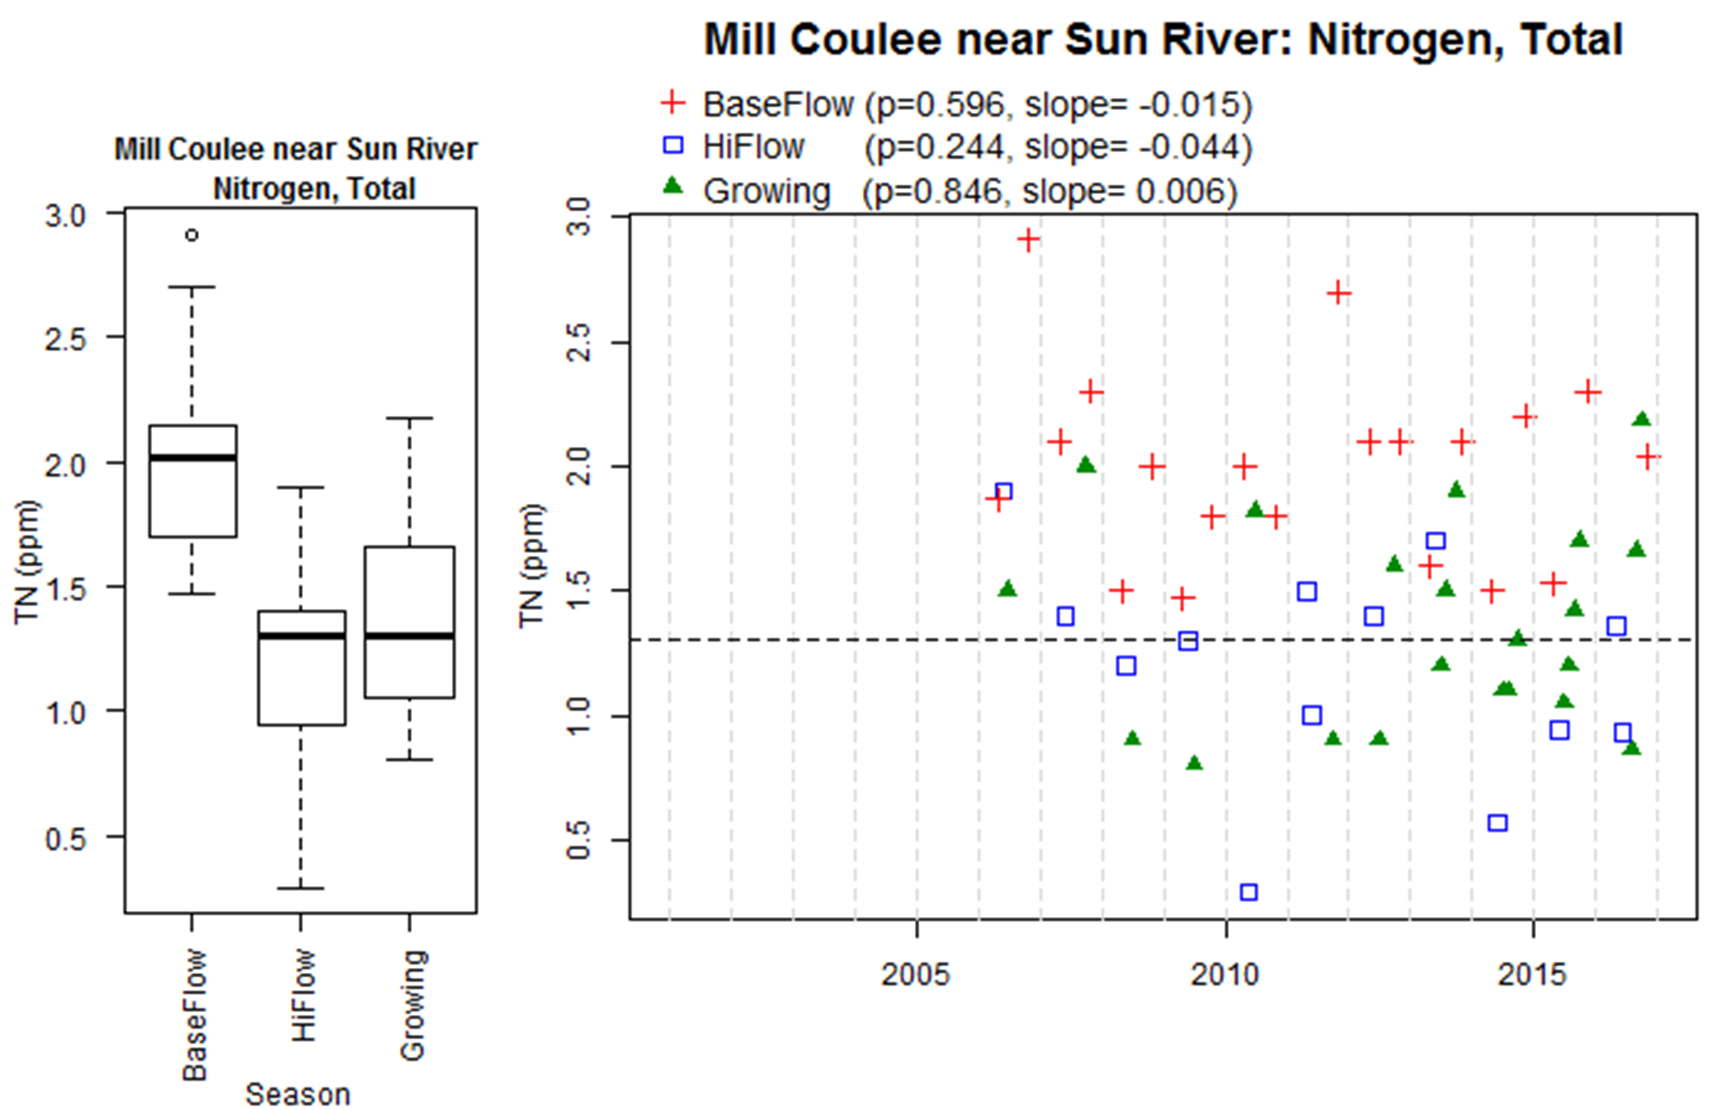
Total nitrogen concentrations are highest during baseflow and are primarily attributed to nitrate.
There are no significant trends in total nitrogen concentration over time at this site.
Total Phosphorus
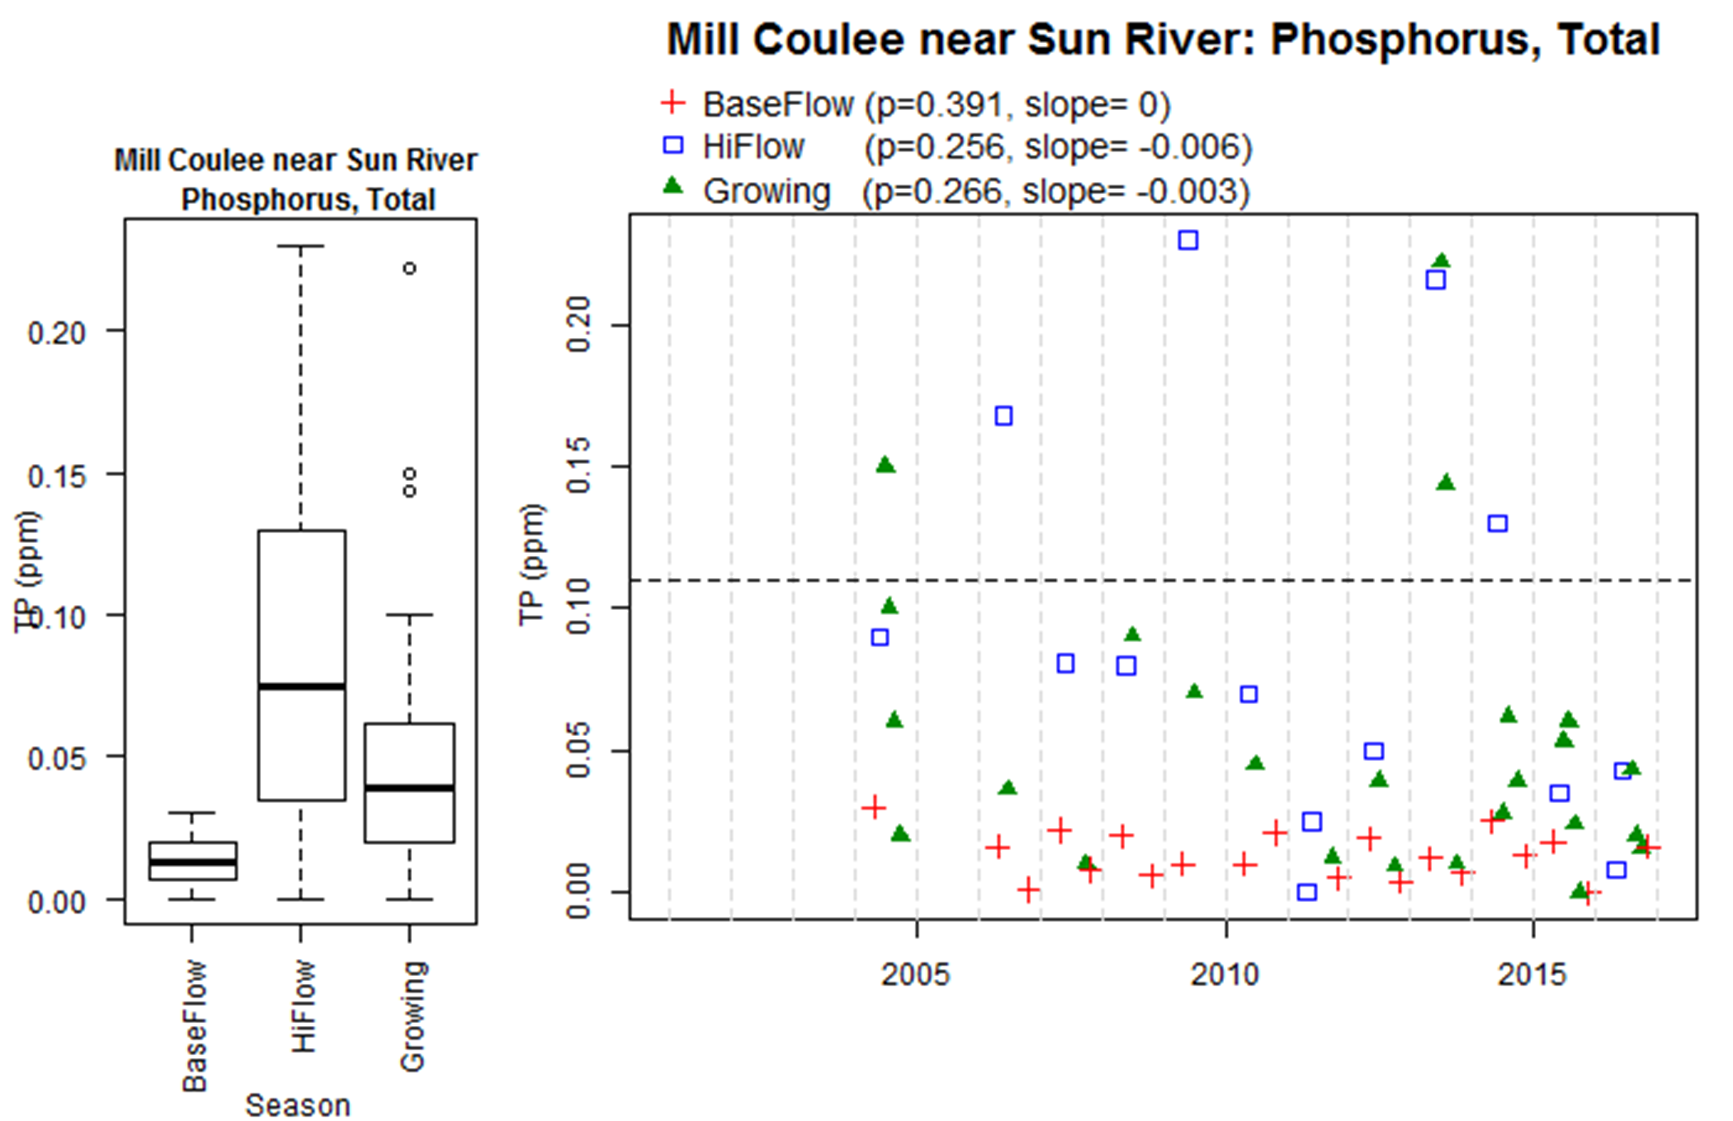
Total phosphorus concentrations are highest during high flow.
There are no significant trends in total phosphorus concentration over time at this site.
Muddy Creek
Nitrate
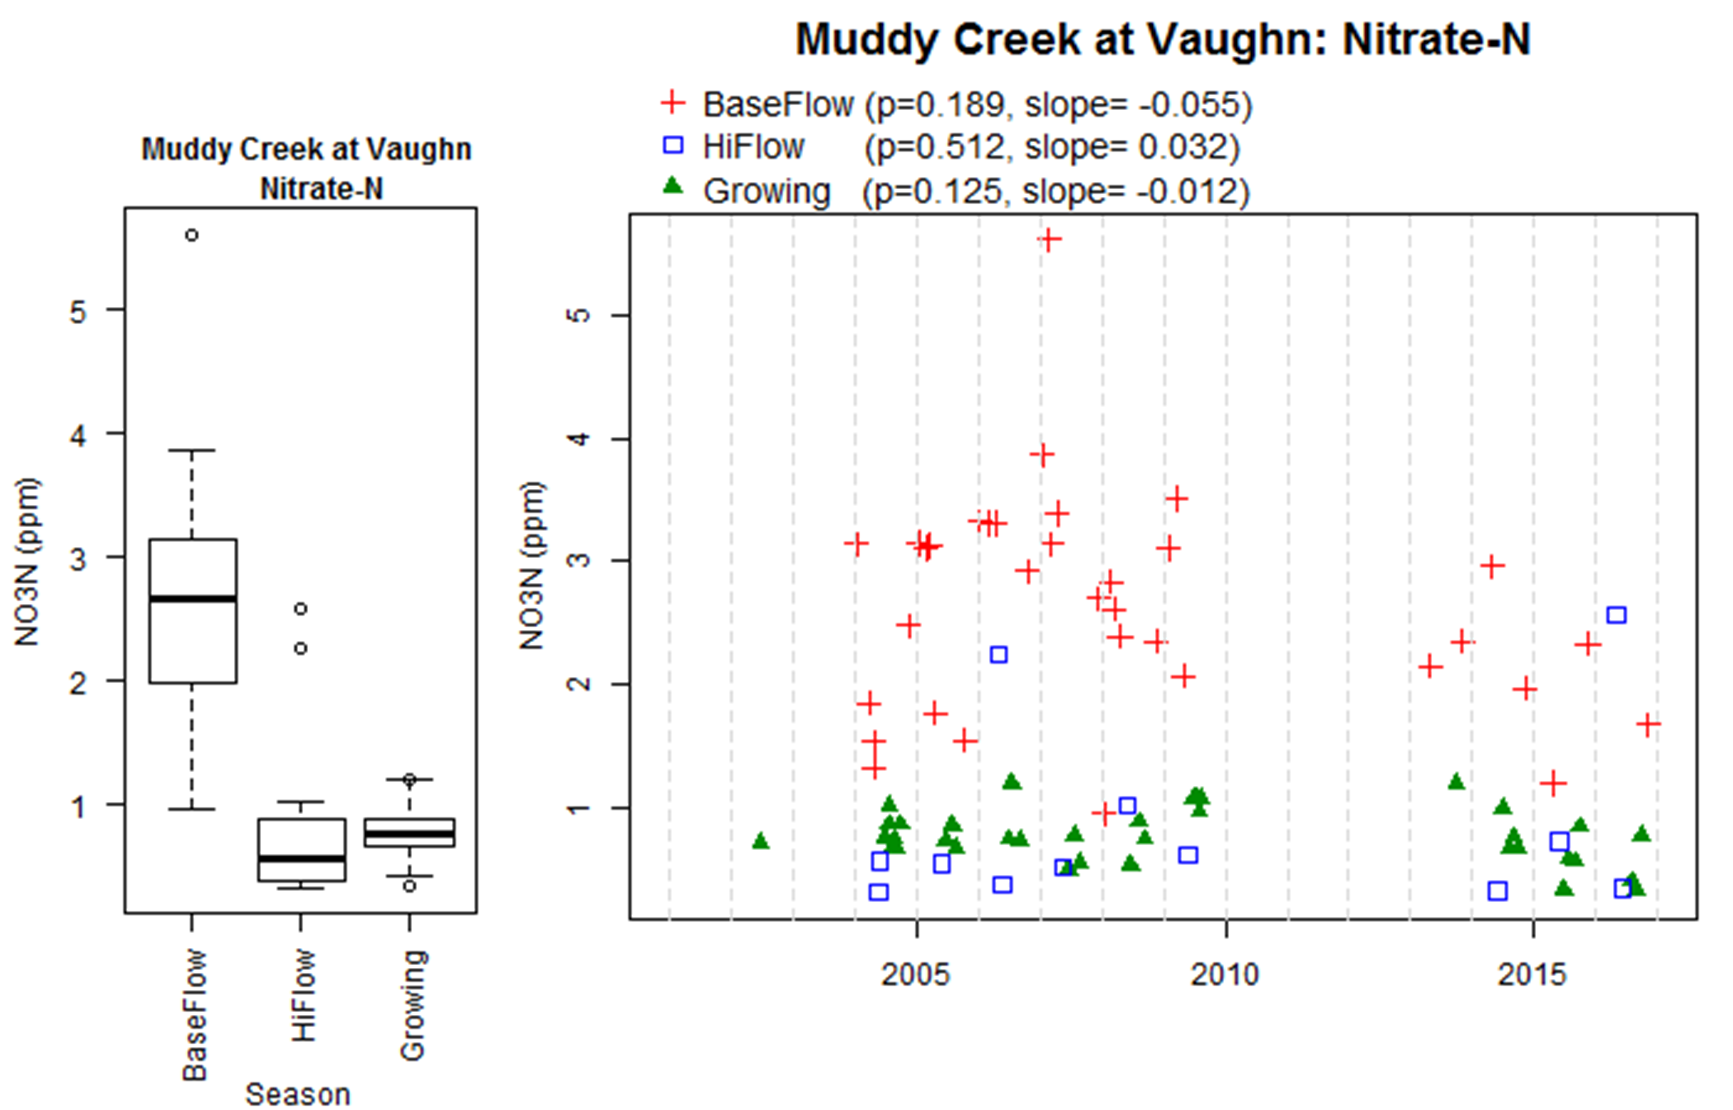
Nitrate concentrations are highest during baseflow at this site.
There are no significant trends in nitrate concentration over time at this site.
Total Nitrogen
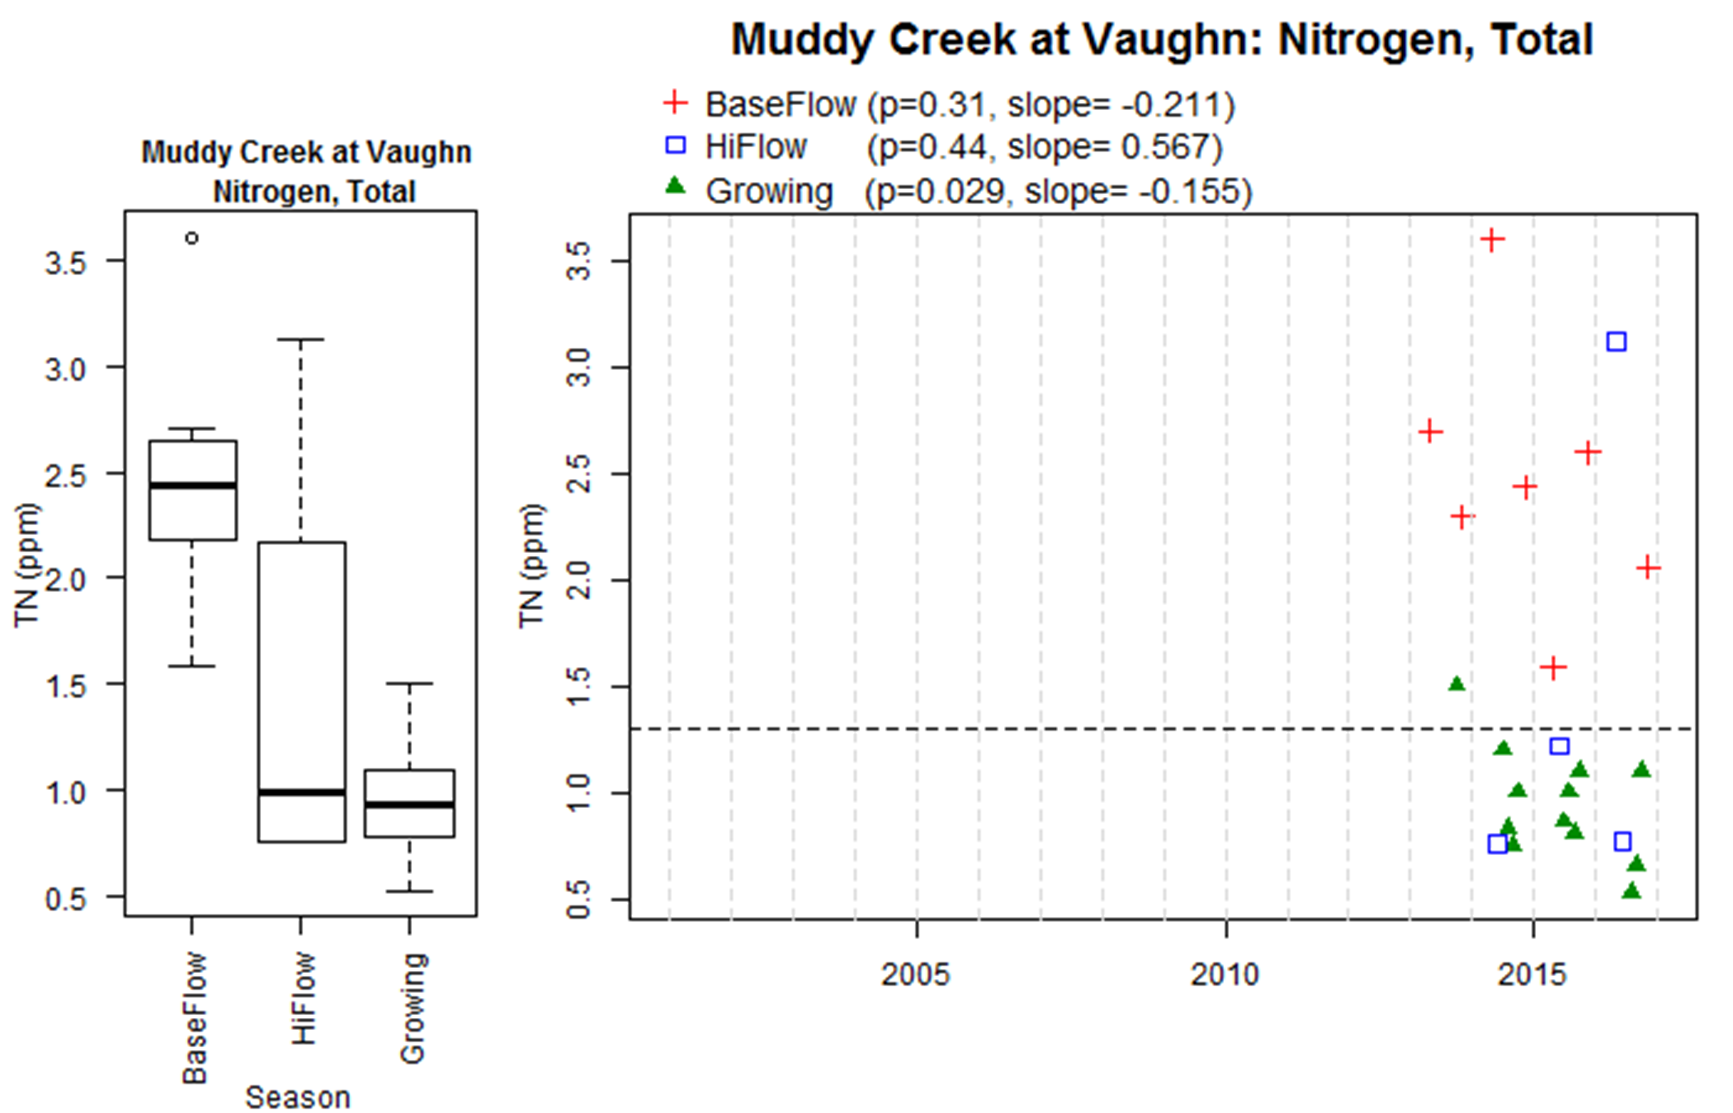
Total nitrogen concentrations are highest during baseflow and are primarily attributed to nitrate.
The short time period of data at this site makes statistical assessment of trends challenging. The short data period is the reason for no indication of significance in trend even though the p value during the growing season is less than 0.1.
Total Phosphorus
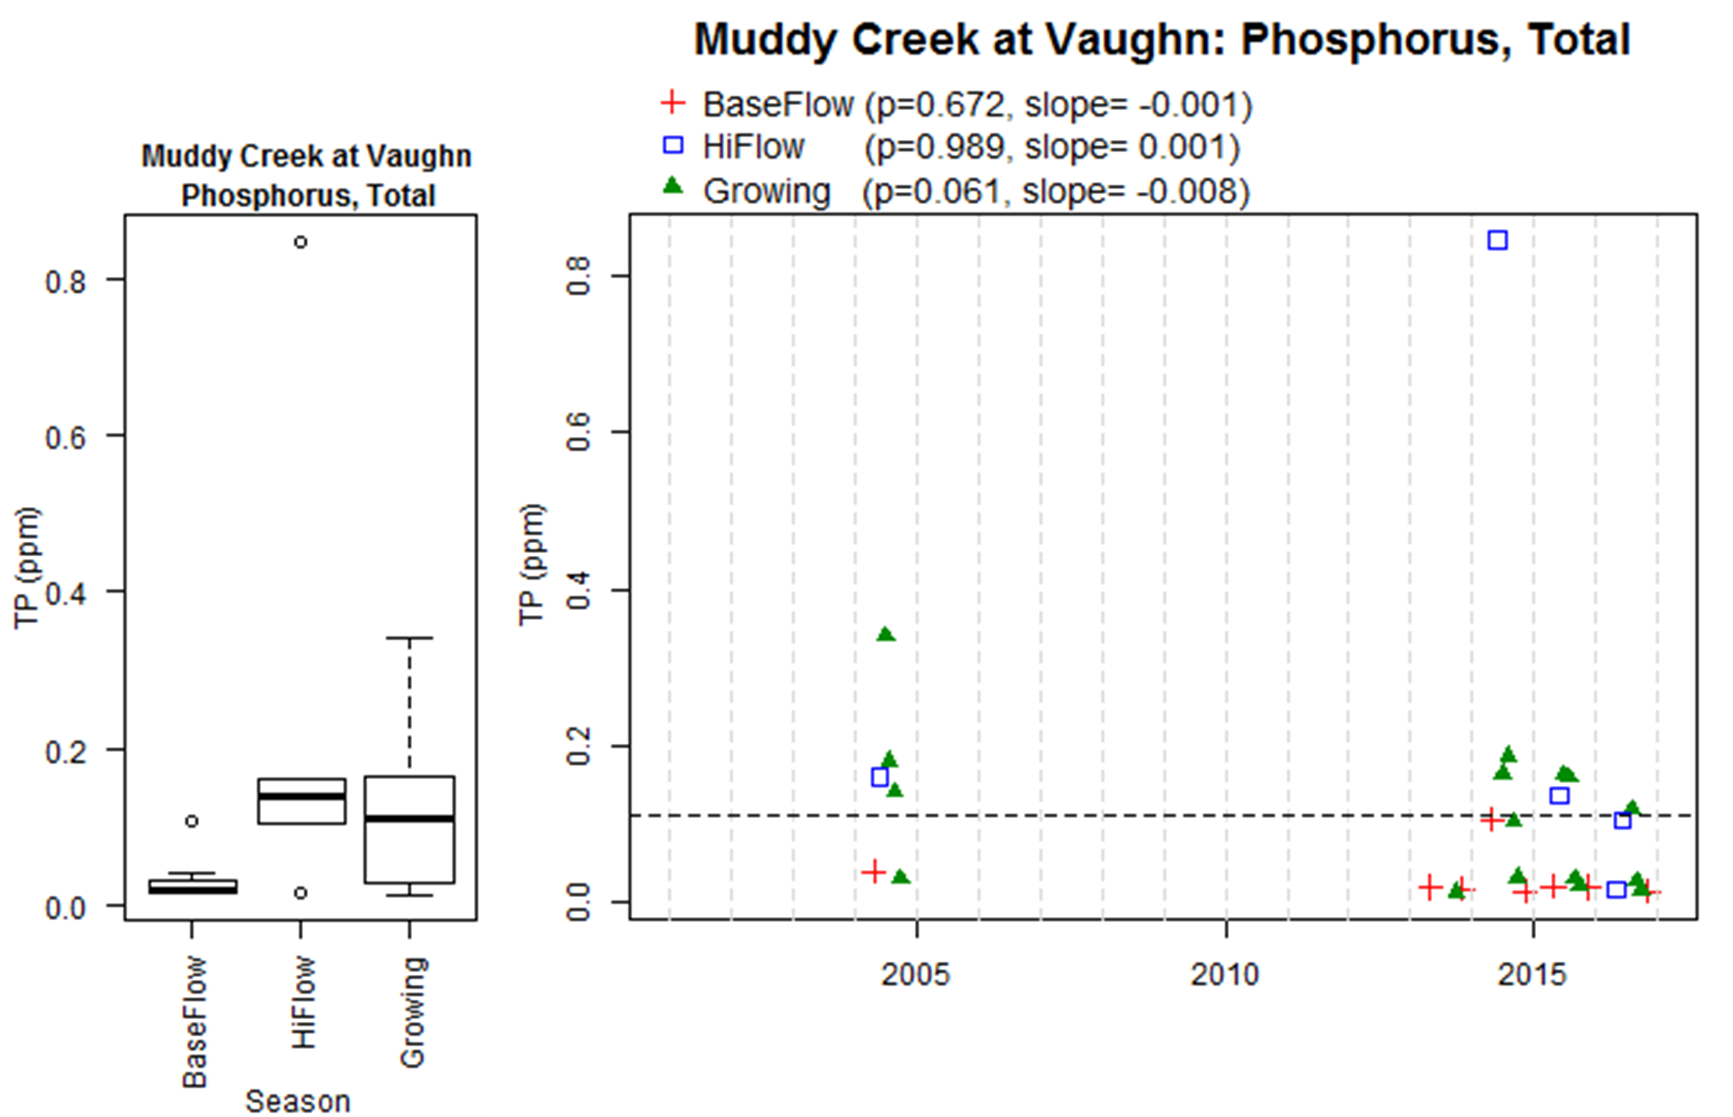
Total phosphorus is lower during baseflow than high flow and growing season at this site.
Sparse data for total phosphorus at this site make statistical assessment of trends challenging. Sparse data is the reason for no indication of significance even though the p value for the growing season is less than 0.1.
Sun at Great Falls
Nitrate
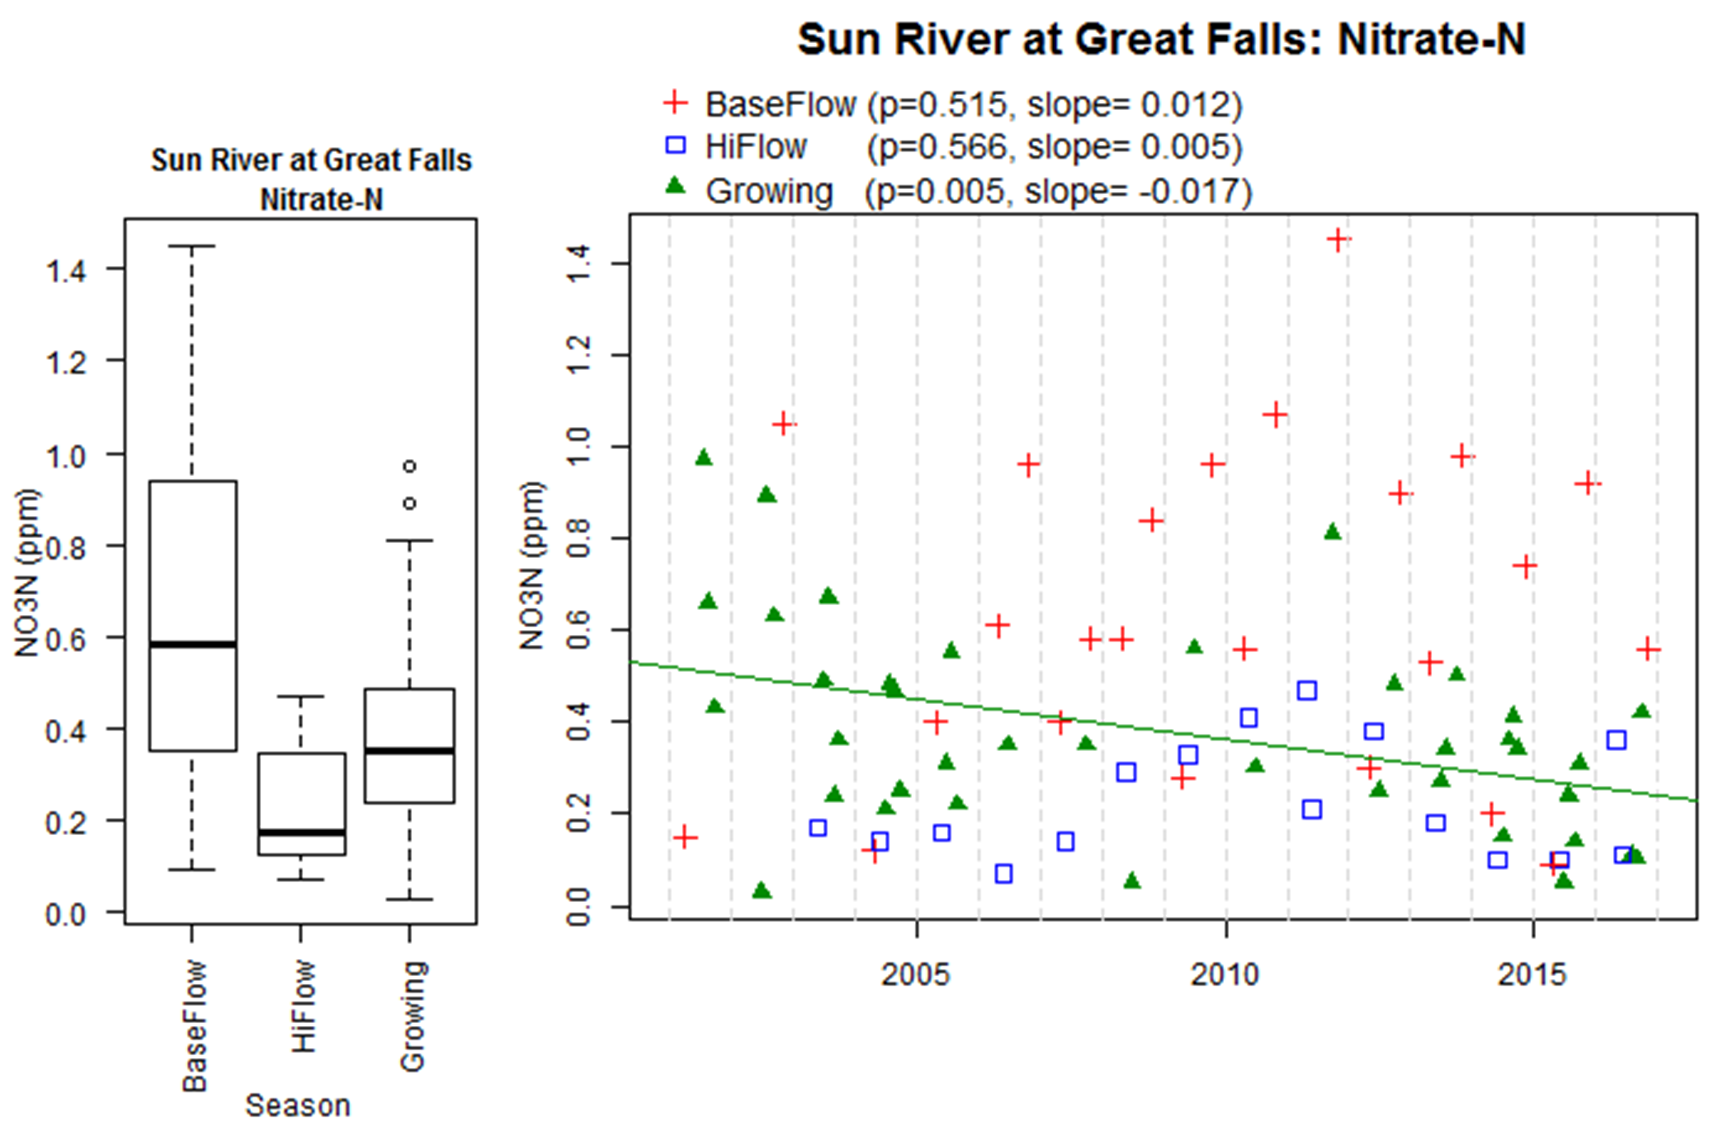
Nitrate concentrations are highest during baseflow at this site.
Over the sampling period, there is a statistically significant decrease in nitrate concentration during the growing season of 0.017 ppm per year.
Total Nitrogen
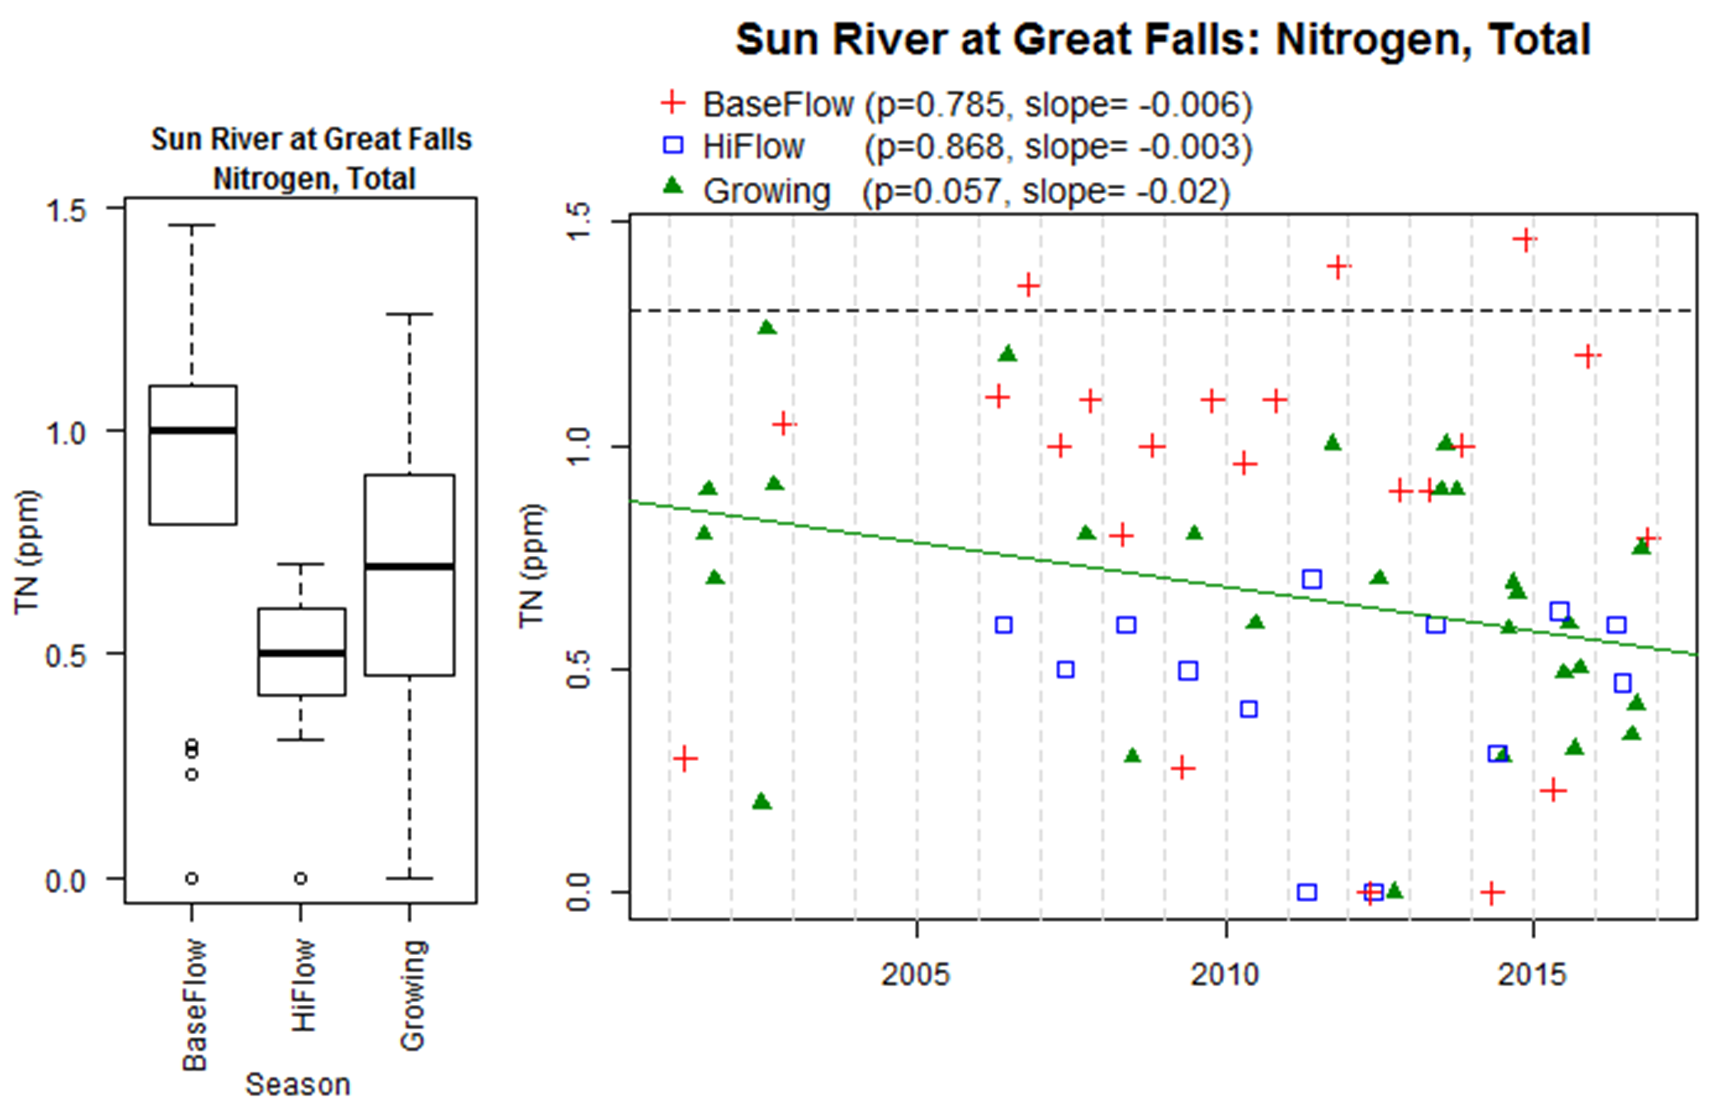
Total nitrogen concentrations are highest during baseflow and are primarily attributed to nitrate.
Over the sampling period, there is a statistically significant decrease in total nitrogen concentration during the growing season of 0.02 ppm per year.
Total Phosphorus
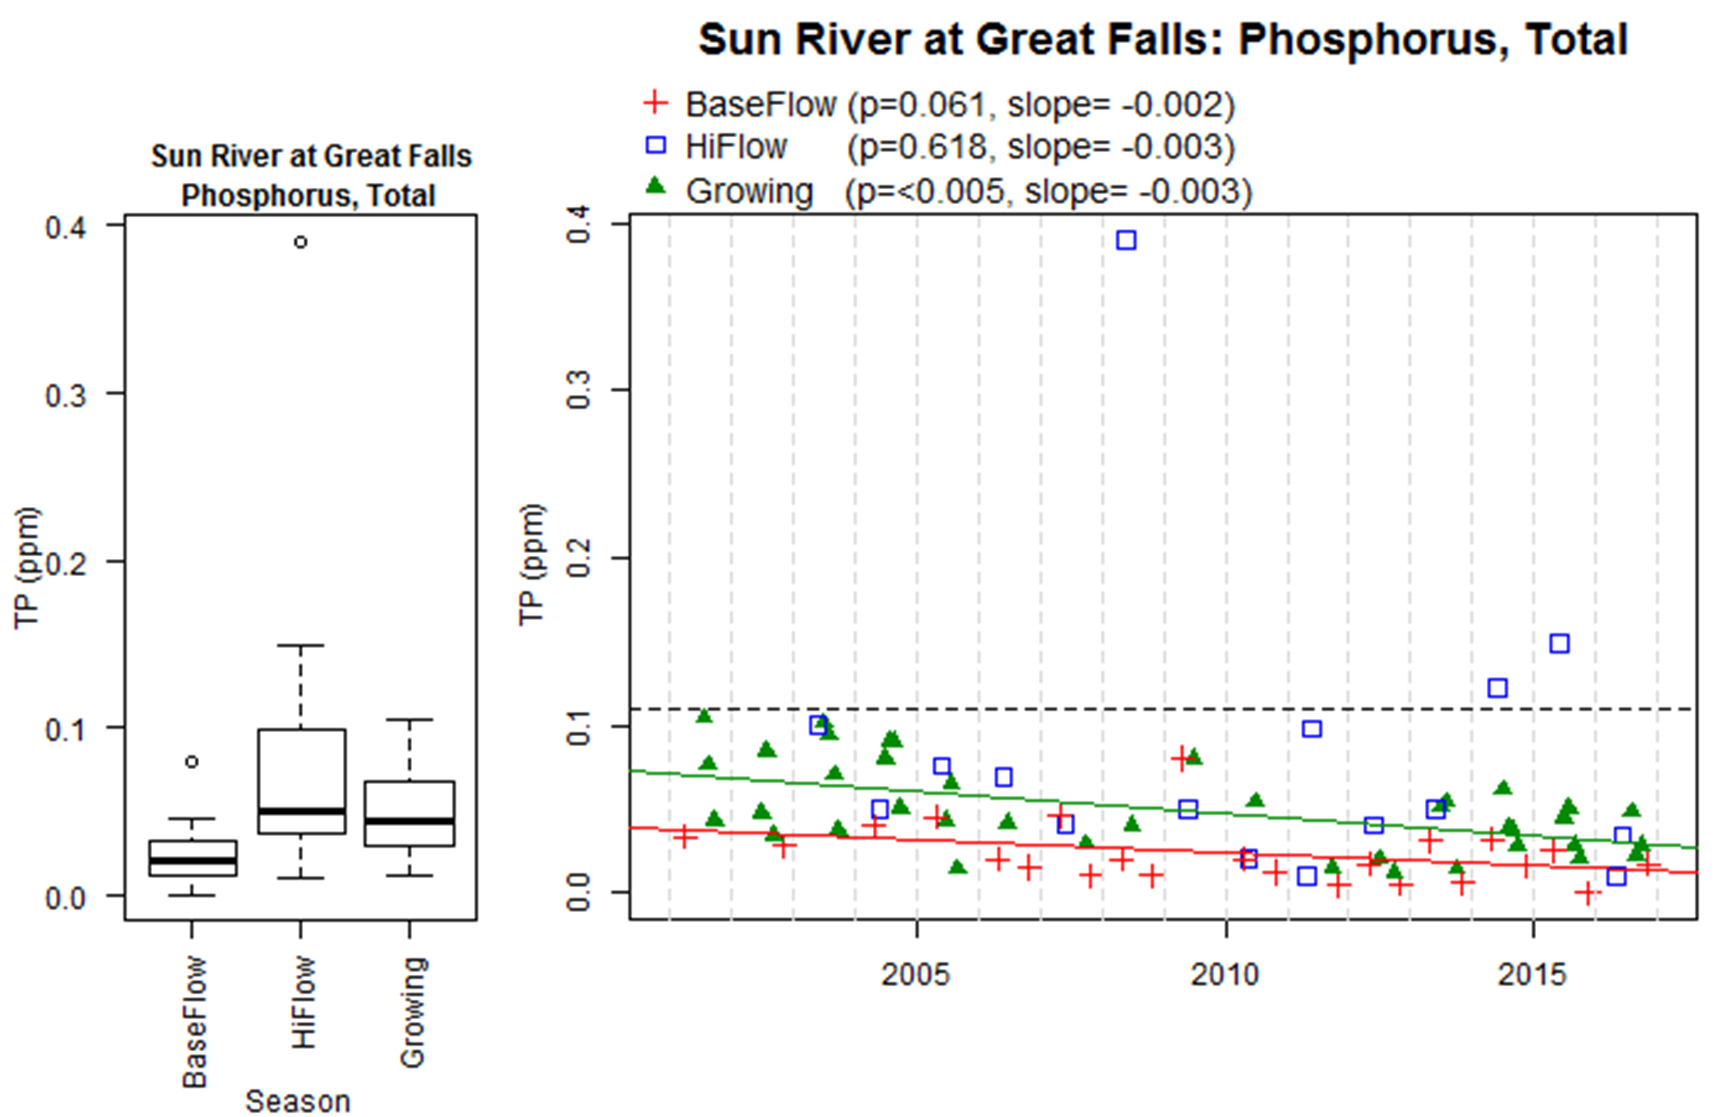
Total phosphorus is lower during baseflow than high flow and growing season at this site.
Over the sampling period, there is a statistically significant decrease in total phosphorus concentration during the growing season of 0.003 ppm per year and during baseflow of 0.002 ppm per year.
References
MDEQ Circular DEQ-12A; Montana Base Numeric Nutrient Standards. https://deq.mt.gov/Portals/112/Water/WQPB/Standards/PDF/NutrientRules/CircularDEQ12A_July2014_FINAL.pdf
MSUEWQ Data Hub. 2019. Online at: https://django.msu.montana.edu/msuewq/
NMLE package; Linear and Nonlinear Mixed Effects Models;
https://cran.r-project.org/web/packages/nlme/nlme.pdf
Sigler, Adam; Torie Bunn, Alan Rollo. 2012. Sun River Quality Assurance Project Plan. Version 1.0 September 19th, 2012. Online at: http://waterquality.montana.edu/vol-mon/images-files/FINALSunQAPPwAppendices_%202012-11-01.pdf
USGS Gage Data; Discharge at USGS gate 06089000 for Sun River near Vaughn MT; https://waterdata.usgs.gov/mt/nwis/uv?site_no=06089000