
Bozeman Creek E.coli Project

Click on the image below to view an interactive map!
Background
Bozeman Creek has been listed as impaired for E.coli by the Montana Department of Environmental Quality (DEQ) since 2006. To better understand
the E. coli issue and increase awareness about water quality concerns, MSU Extension Water Quality
worked with local citizens to collect and analyze water samples for E.coli along the length of Bozeman Creek in 2012 and 2013. This project was made possible
through funding by DEQ.
E. coli bacteria are present in the feces of warm blooded animals and are an indicator of
fecal pollution in water. Most types of E. coli are not pathogenic, but a positive test for E.coli could indicate the presence of other harmful pathogens.
Bozeman Creek provides incredible quality drinking water as it flows out of the Gallatin
Mountains and a portion of the creek is diverted for city water supply use. Bozeman
Creek picks up pollutants as it flows through the valley (E.coli, sediment, and nutrients). Picking up after pets, ensuring septic systems are working
properly and being aware of what runs off our property during storms are key steps
we can take to help address these issues.
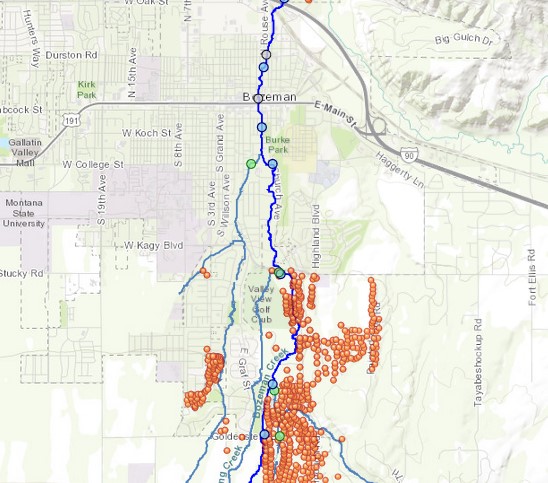
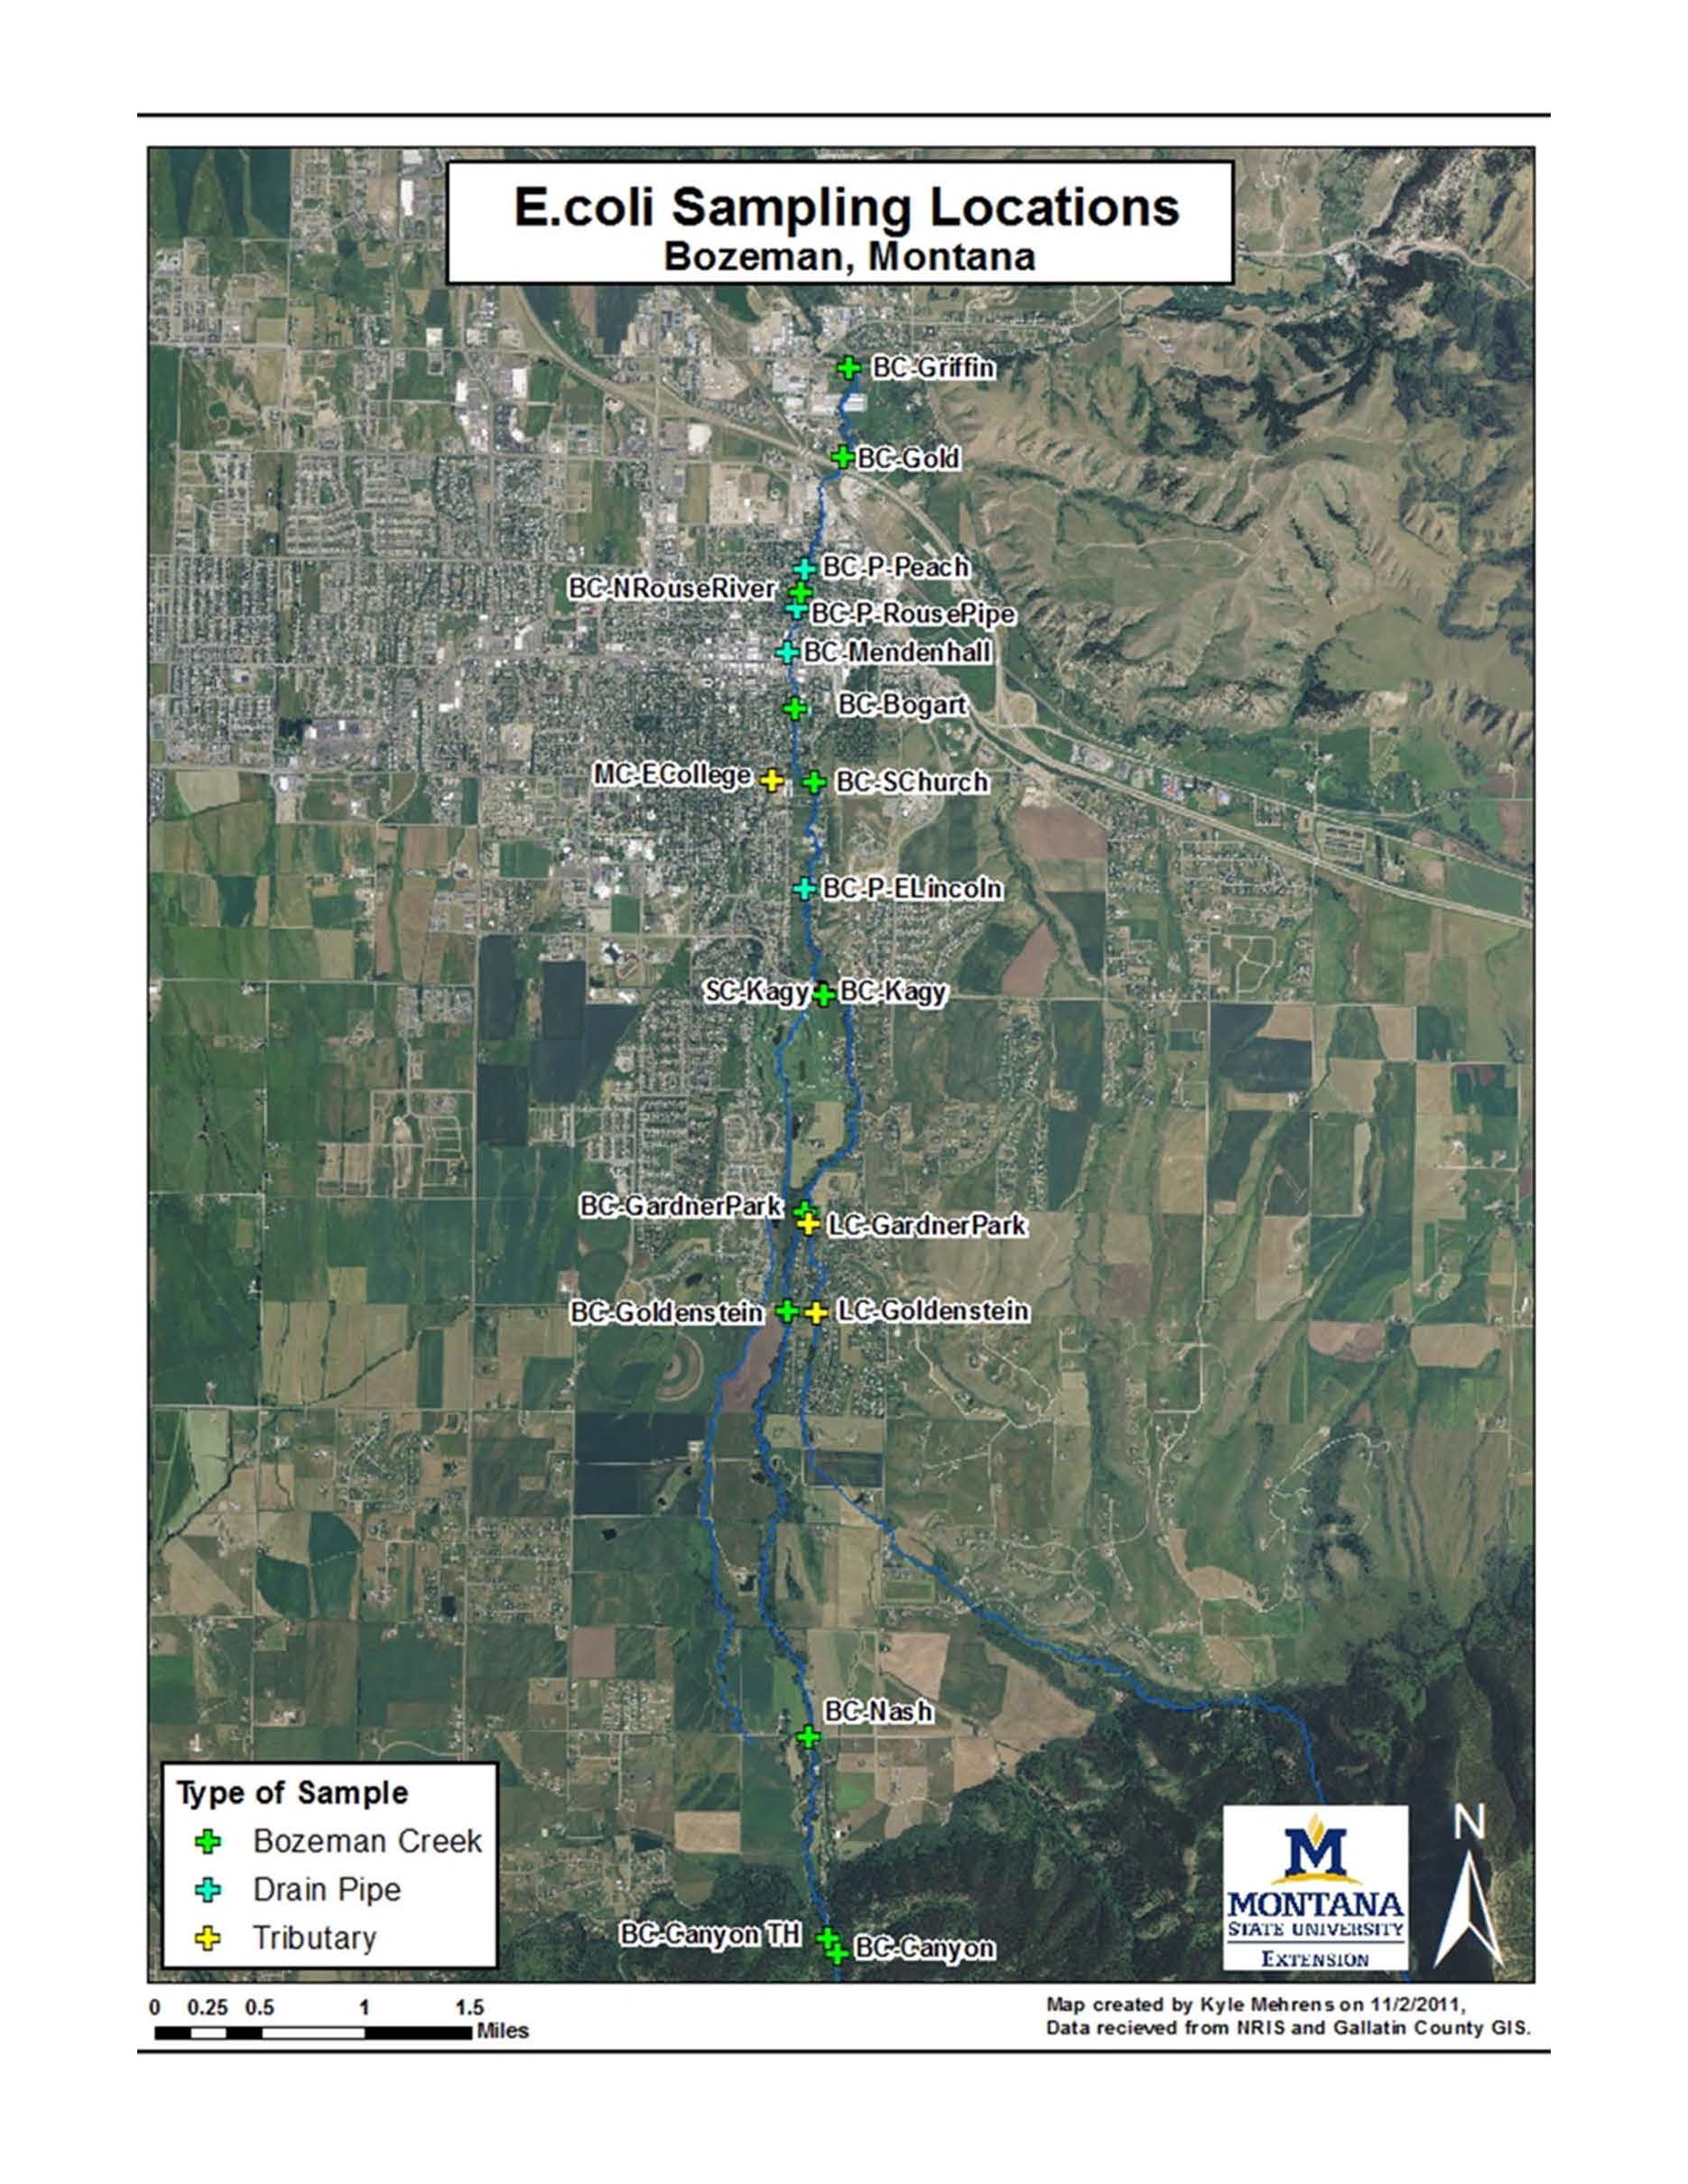
Results of the project are summarized below. To view a complete map of our sample
sites, take a look at the E.coli Sampling Locations Map.
Bozeman Creek E.coli SAP and SOP
Watch our short video outlining E. coli issues on Bozeman Creek to find out actions you can take to help reduce E.coli pollution.
Bozeman Creek E.coli Project video:
Results
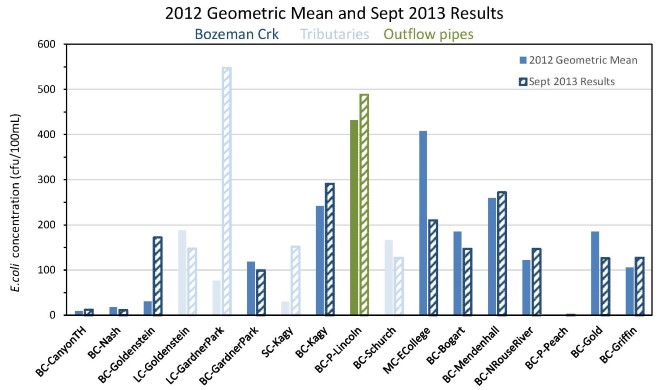
- The solid bars represent the geometric mean values from four events in 2012. The dashed bars represent data collected on Sept 24, 2013.
- Bozeman Creek has lower concentrations of E.coli before traveling through city limits, higher concentrations through the city and lower concentrations north of downtown before Bozeman Creek confluences with the E. Gallatin River.

- The red line indicates a concentration of 126 cfu of E.coli, a benchmark to determine if a waterbody is impaired for E.coli.
- Samples were collected in the morning and evening of Sept. 24 (~ 8 hours apart). Daily variation of E.coli concentrations ranged from 15% to over 50% difference on Sept. 24, 2013.

- 2013 E.coli concentrations are higher than 2012 from the Sourdough trailhead (BC_CanyonTD) until the BC_Kagy site.
- 2012 E.coli concentrations are higher than 2013 from BC_Kagy until Bozeman Creek confluences with the E. Gallatin River.
- Comparing 2012 and 2013 estimated flows at BC_CanyonTH and BC_Griffin during the two sampling events, we find that 2013 flows
were lower at BC_CanyonTH, but higher at BC_Griffin.
- This change in flow indicates higher contributions of runoff and flow from tributaries further down Bozeman Creek, possibly diluting E.coli concentrations
- Baseflow at BC_CanyonTH was slightly lower during 2013, reducing dilution and increasing E.coli concentrations
- Becuase we found the highest E. coli concentrations during low flows and vice versa, this suggests a consistent source of E.coli pollution to Bozeman Creek with dilution occurring at high flows and concentration occurring at low flows
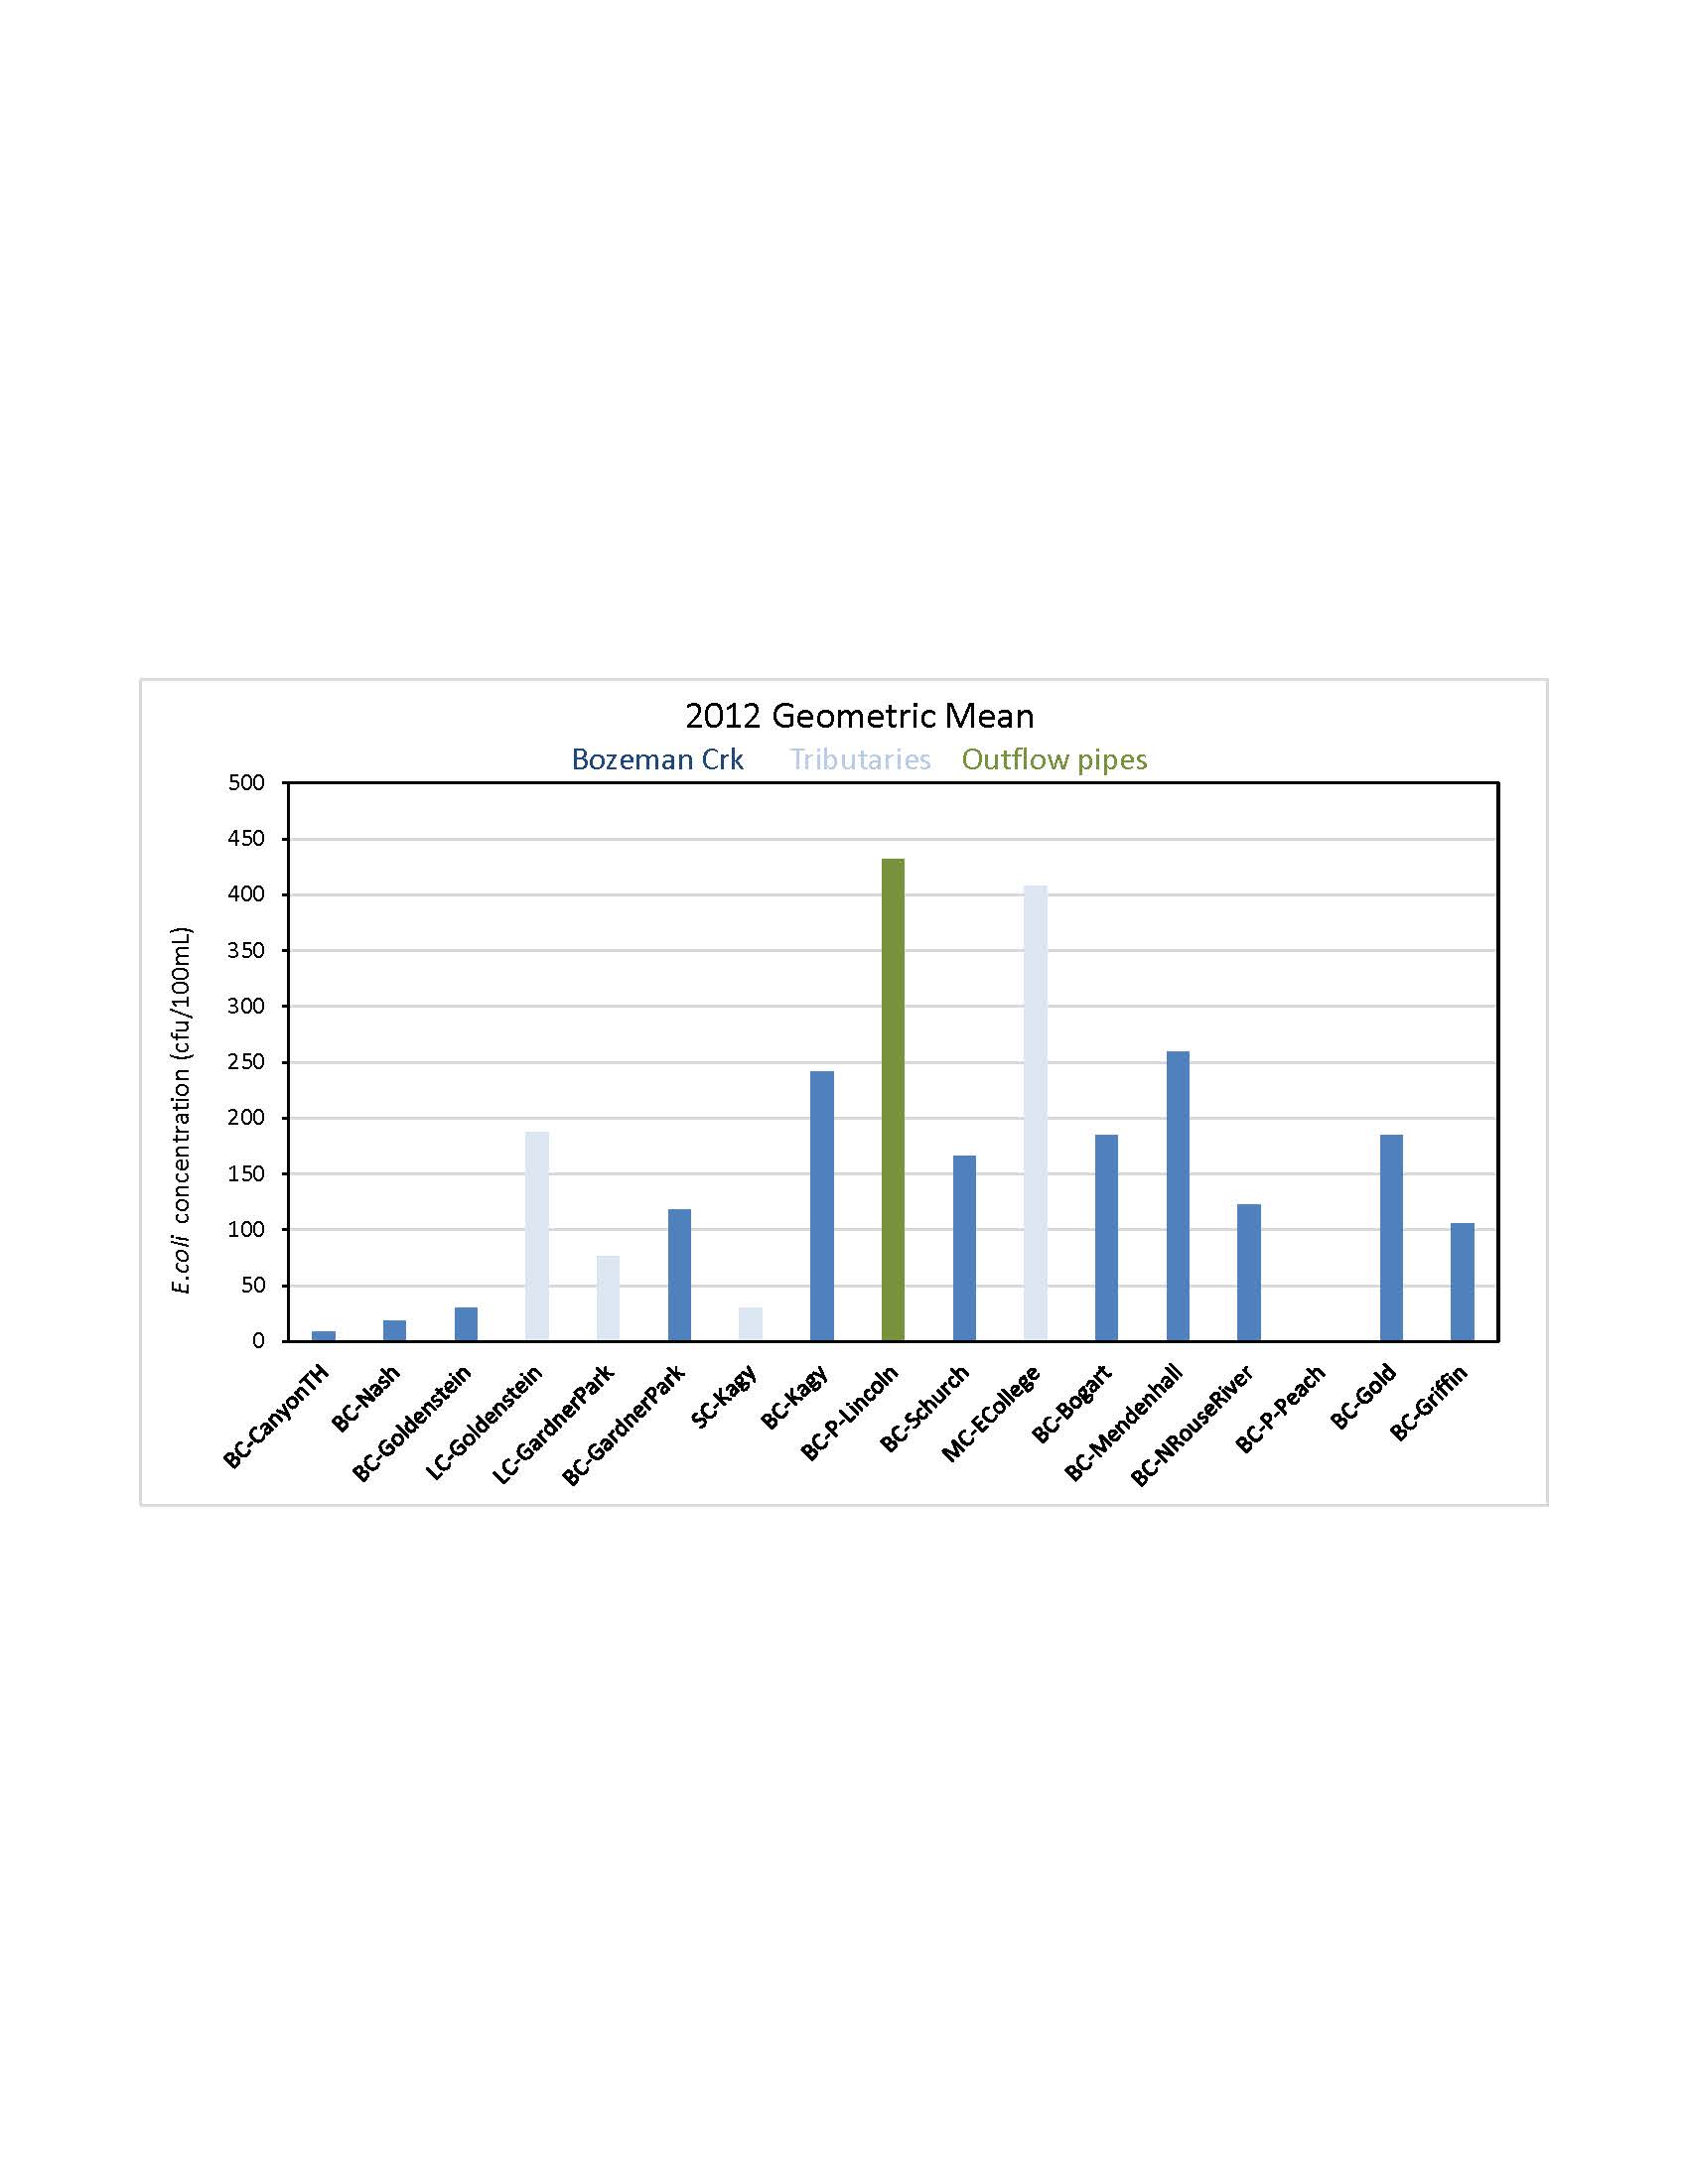
Summary of Findings for 2012
- E. coli concentrations measured in Bozeman Creek range from as low as non-detection at the Sourdough Creek Trailhead (BC_Canyon TH), to as high as 1,300 CFUs/100 mL where Bozeman Creek flows under Kagy (BC_Kagy). The threshold for E. coli that is part of the water quality standard set by MDEQ is 126 CFU/100mL, so the highest value at the Bozeman Creek Kagy site is 10 times that number.
- The E. coli concentration at the Canyon Trailhead site did not exceed the threshold for any of the 2012 sample events (range 0 to 119 CFU/100mL).
- The concentration just before Bozeman Creek enters the East Gallatin (BC_Griffin) was relatively stable ranging between 46 and 148 CFU/100 mL.
- The concentrations at sites where the creek flows through developed areas were much more variable, illustrating the influence that diverse human landuse has on the E. coli pollution to Bozeman Creek. Concentrations were most dynamic in Bozeman Creek at Kagy (BC_Kagy) where the range was from 28 to 1300 CFU/100mL.
- The Spring Creek which runs parallel to Bozeman Creek south of town and was sampled (SC_Kagy) just above its confluence with Bozeman Creek at Kagy (orange dot on map is obscured behind the green Bozeman Creek dot) consistently had a lower E.coli concentration than Bozeman Creek. This suggests contributions to Bozeman Creek through that reach are not occurring in the Spring Creek, which provides an opportunity to contrast the two stream reaches for insight about an explanation for elevated E. coli levels in Bozeman Creek.
- Consistently higher concentrations of E. coli in Mathew Bird Creek (MC_Ecollege) than just downstream in Bozeman Creek at Bogart Park (BC_Bogart) after the two meet, indicates that there are opportunities to reduce E. coli pollution in the Mathew Bird Creek watershed.

You can see the collected data for all sites by viewing a PDF of the 2012 Bozeman Creek E.coli Study. The empty rectangles represent tributaries of Bozeman Creek.

You can see the collected data for all sample sites by viewing a PDF of the 2012 Geometric Mean Graph. The light blue rectangles represent tributaries of Bozeman Creek.
To view dishcarge and loading data for each sampling event in 2012, take a look at a PDF version of the 2012 Load and Discharge Dataset.