
Data Analysis
Data Analysis Guidance
Written by W. Adam Sigler
Water Quality Specialist- MSU Extension Water Quality
Updated May 31st, 2019
A downloadable PDF version of this webpage is available here
Contents
- Comparing Data to Thresholds
- Load Calculations
- Trends Over Time
Water quality values are difficult to interpret without knowing what levels are of out of the ordinary or what levels may cause problems for people or organisms using the water. Depending on the water body, water quality standards have often been set to establish concentration targets to protect water for different uses. Different water quality is expected naturally in different parts of the state. High elevation streams and rivers in the western part of the state are naturally expected to have lower temperatures and lower salinity. Lower elevation streams, especially in the eastern portion of the state have naturally higher temperatures and higher salinity in many cases. Water quality standards are often different for different parts of the state and/or might only be applicable for certain parts of the year.
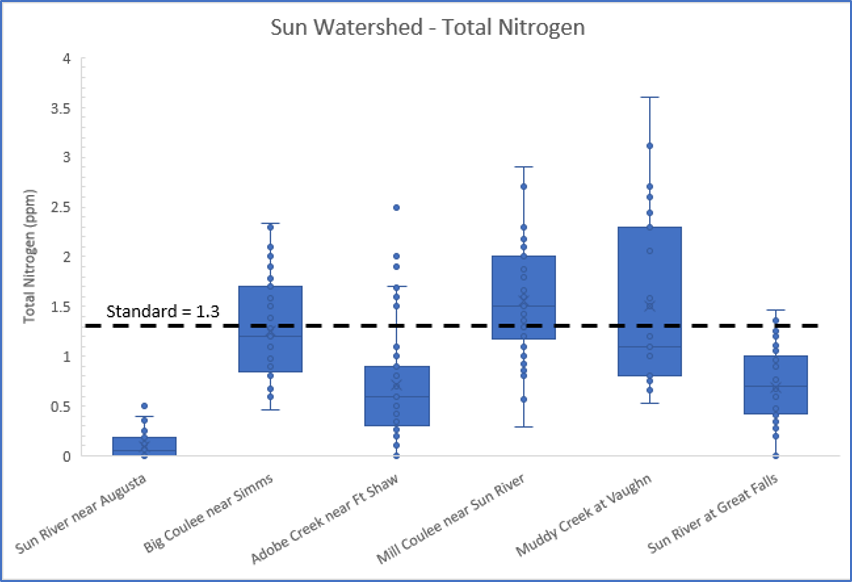
Linked here you can find an Excel spreadsheet used to create this box and whisker plot showing Total Nitrogen concentration by site and the percent of samples exceeding a concentration of interest. There is also a video linked here (24:08 minutes) which overviews the process for creating the plots.
Useful documents:
- Human drinking water – US EPA Maximum Contaminant Levels
- These are national level standards that regulate maximum concentrations acceptable to provide to users on public water supplies. When surface water is used by public water supplies, it will always need to be treated to remove sediment and pathogens, so sediment and pathogen numbers measured in stream are not appropriate to compare to these standards.
- Montana general water quality – MDEQ circular 7
- This document includes human drinking water standards from EPA as well as Montana specific standards for human recreation and aquatic life.
- Montana nutrient standards – MDEQ circular 12
- This document includes standards for nitrogen and phosphorus for wadable streams in Montana. The standards differ based on Ecoregion and are applicable only in the summer months when nuisance algae is commonly an issue in streams.
- Stream classifications for Montana
- In Montana streams are given a simple water use classification code with a letter and a number (example: B2), which determines what water quality standards apply. Most streams and rivers have letters A-C and numbers 1-3. The letters are related to expected salinity with A and B being low salinity, C being high salinity. The number is related to expected temperature with 1 being cold water, 3 being warm water, 2 being a stream reach transitional between warm and cold. This classification does not provide detailed insights about water quality expected for a stream. Classifications are outlined in Montana administrative rules, but for impaired streams it may be easiest to find classifications in the MDEQ Clean Water Act Information Center.
Assessing the fraction of pollutant contribution that different tributaries or stream sections are making to a river requires calculation of load (concentration times stream flow). The fraction of contribution from a tributary can be readily presented as a pie chart.
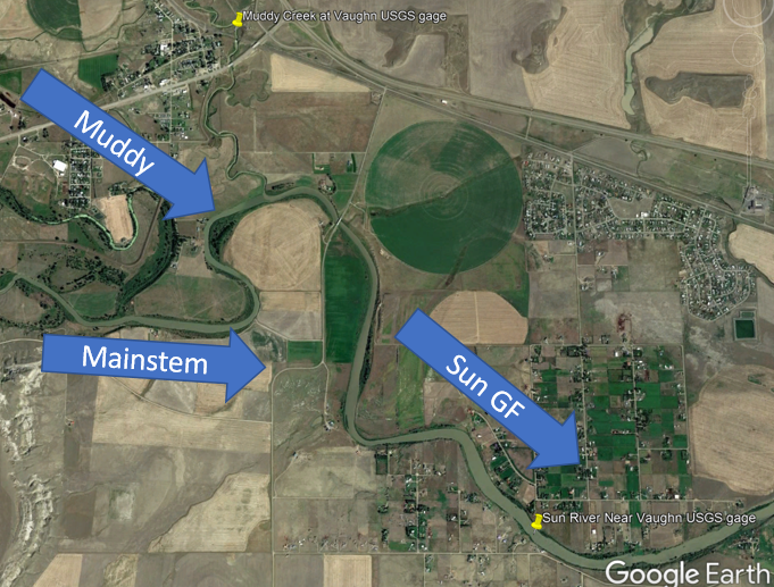
For example, the Sun River Watershed Group collects total nitrogen concentration data for various sites on the Sun River and tributaries. Two of the sampling locations have USGS gages at or near the site which provide daily flow data.
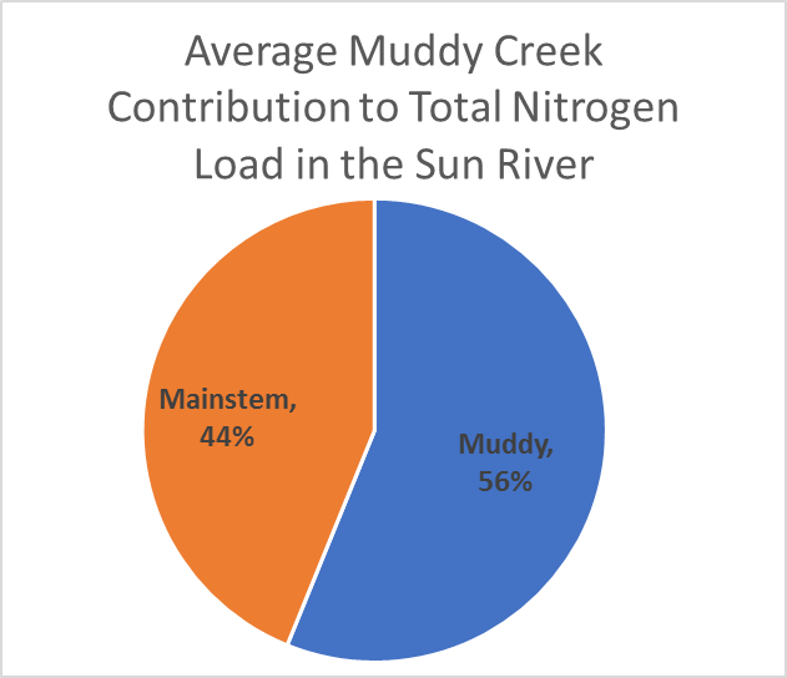
A spreadsheet is available here, which has the calculations to convert concentration and discharge to load and create the example pie chart. A video is available here (41:31 minutes), which walks through downloading the nutrient data from the MSUEWQ data hub, downloading the flow data from USGS, calculating loads, and creating the pie chart.
Tracking change over time in water quality can indicate whether management efforts are making a positive impact or whether increasing stressors in a watershed are degrading water quality. Assessment of trends in water quality data over time can be done qualitatively by simply plotting and looking at data. However, there is often a lot of variability in data naturally with seasons or flows, so statistics and/or looking at the data in more refined ways may be necessary.
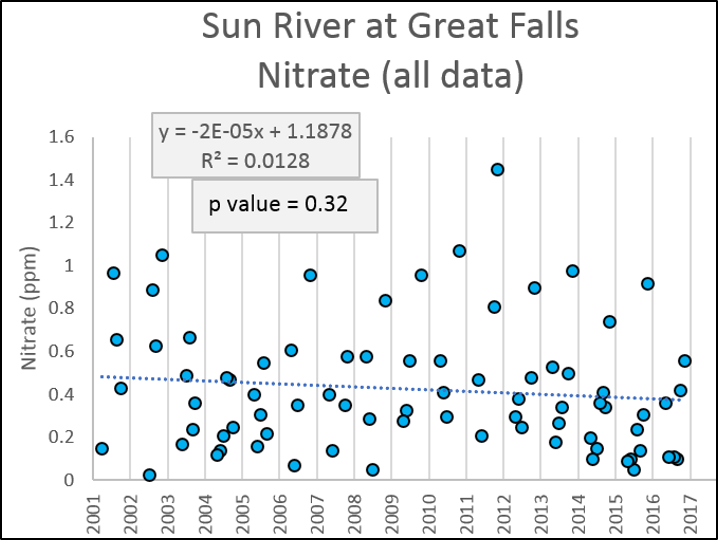
Looking at all of the nitrate data for the Sun River at Great Falls over a 15 year period (first figure) suggests a decreasing trend, but there is a lot of scatter in the relationship (low R2) and the statistical significance of the relationship is weak (large p value.)
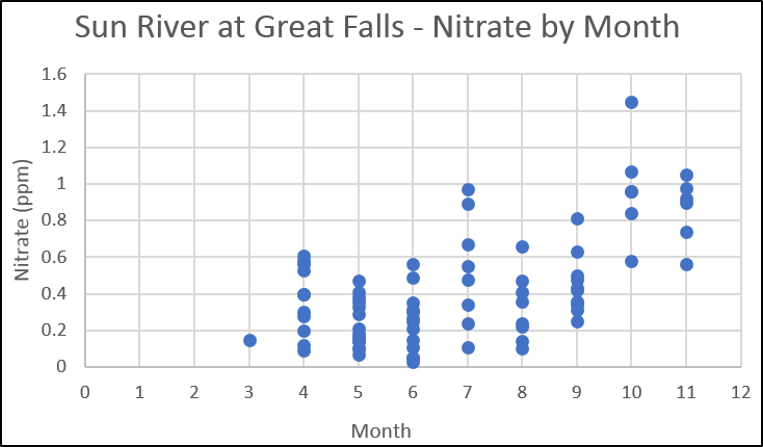
Part of the reason for the scatter in the relationship is the predictable seasonal pattern in nitrate (second figure).
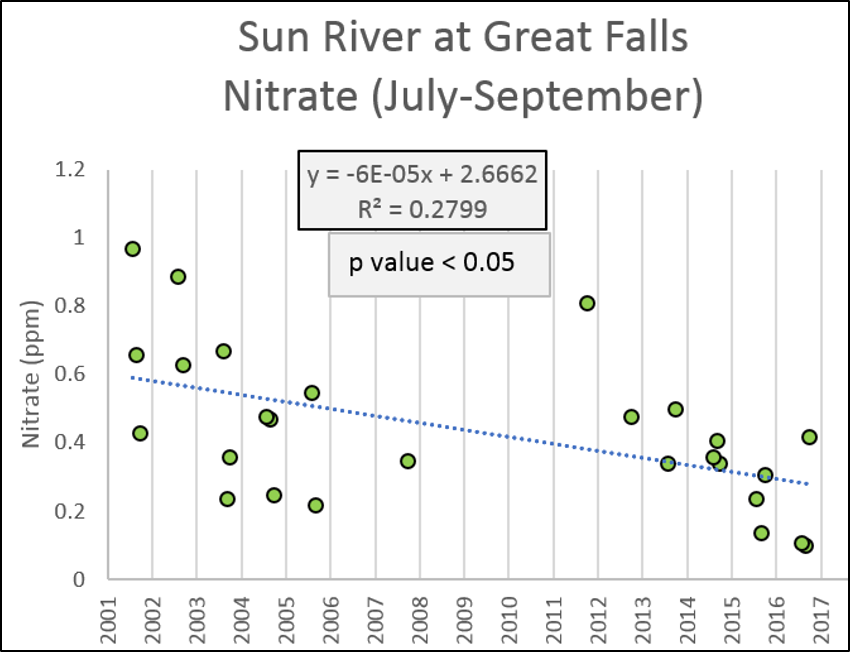
If we look at the data for one season together, the relationship becomes clearer (third figure). Looking at the data seasonally may also be of interest because nuisance algae growth related to nutrients typically occurs in warm summer months and that is when numeric nutrient criteria apply in Montana.
Here is a link to a spreadsheet where these plots were created as an example and here is a link to a video (22:23 minutes) outlining how to make the plots and calculate the statistics.