
Story Maps
This page is a draft and is still under construction.
Story Maps are great tools for telling the story of your area of interest, be it a watershed, a county, or another extent. Story Maps are particularly useful for communicating information about the current projects and goals of your organization. This page will walk you through the fundamentals of creating an engaging, descriptive Story Map.
Examples
Based on these examples, think about what data you’ll want to obtain in order to convey your story.
Note: While these instructions were written specifically for watershed groups, the same principles and methods can apply to county extension service areas, city boundaries, or national forests.
Downloading Data
In order to create a map, you need data!
If your area of interest is a watershed, here are some datasets you might need to tell your story:
- Watershed boundaries/outline – HUC8, HUC10, and HUC12 watersheds can be downloaded from the National Hydrography dataset.
- Streams and rivers within your watershed – This data can be queried out from the National Hydrography dataset to obtain flowlines for your watershed.
- Monitoring sites – This data can be downloaded from MSUEWQ’s Data Hub in .csv format as described in this document. If you store data in the MSUEWQ Data Hub, you can download a list of sites from there with links to the sites' data and photos. Your organization may also have monitoring site data in an excel file.
- Project locations, historical sites, or points of interest – If you don’t have a shapefile of these already, the easiest way to import these into Story Maps is to create a .csv file with the latitude and longitude.
Watch the following videos for guidance on obtaining data from the National Hydrography Dataset and the Data Hub:
Downloading National Hydrography Dataset from USGS
Downloading data from Data Hub
Specializing Layers
If you don’t have access to ESRI’s ArcMap application, you can download free software (such as Quantum GIS) or you can skip this section; however, that would result in a less compelling map.
Because your Story Map is going to walk your viewers through the story of your area of interest, you might want to emphasize different features as they scroll through.
An inverse watershed layer, where the watershed or area of interest is cookie cuttered out and the layer is composed of a single element covering everything except your watershed, is a useful way to emphasize your watershed or area of interest while still retaining some reference information in the background, and looks more clean-cut just a bold outline. This layer can be turned semi-transparent, allowing you to display your watershed clearly with the surrounding area partially grayed out, as seen in the image below. This video shows you how to make an inverse watershed layer:
Making inverse watershed layer
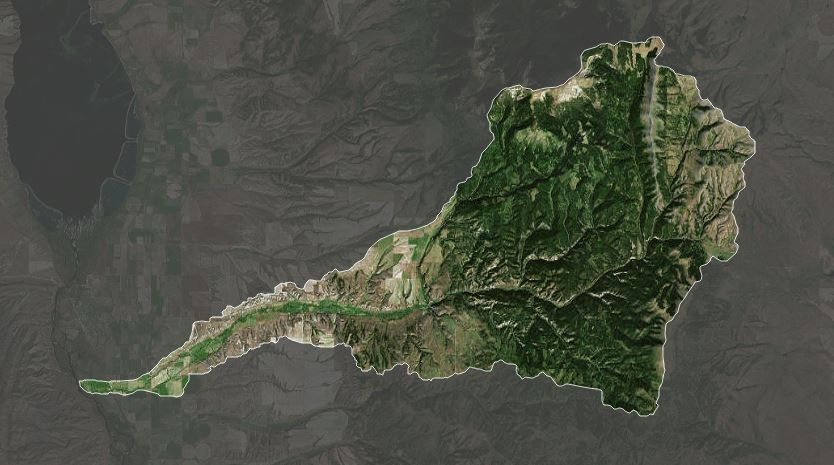
The Deep Creek Watershed as an inverse watershed layer
After downloading flowline data, you’ll likely want to create a shapefile of just the streams and rivers of interest. You can do this by using one of the methods described in this video:
Creating layer from subset of NHD flowlines
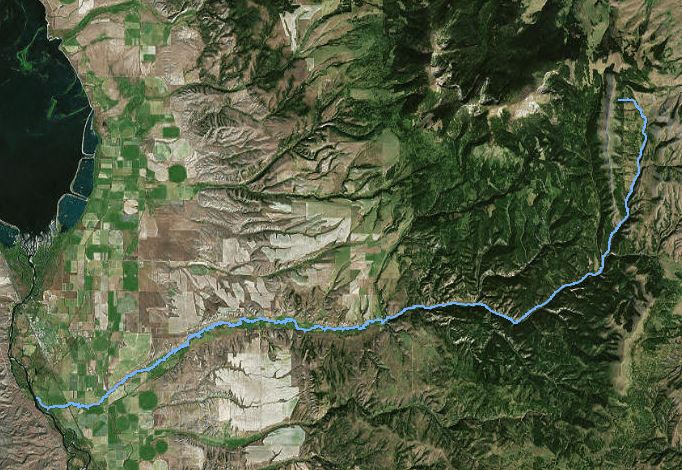
Deep Creek layer from NHD flowlines
You may also want to emphasize certain portions or reaches of a stream that are impaired, recently underwent restoration, or are critical habitat for a keystone species. You can do this by following the directions in this video:
Creating layer from manually selected section of stream segment
ArcOnline
ArcOnline is the interface between the Story Maps application and ArcDesktop. It allows you to upload your data and create maps that can be shared online, embedded in websites, or used in a Story Map.
It’s important to note that ArcOnline is very limited in comparison to ArcDesktop and is meant for displaying data, not editing it. You can upload spatial data as zipped shapefiles (all shapefile subfiles in one zip file) or .csv files, as well as GPX and GeoJSON files. You also can’t upload a file with more than 1000 features (for example, streams for all of Montana), so that’s important to keep in mind when preparing your data in ArcDesktop.
Adding data (shapefile and .csv file from Data Hub) to an ArcOnline map
Story Maps
Now it’s time for you to tell your story; let’s head over to ArcOnline’s Story Maps application.
There are several different types of Story Maps you can choose from; they each have different purposes and different ways of displaying maps. The Story Maps that are useful for talking about your watershed are: (describe each and when to use)
- Cascade: this application is good if you want your viewers to scroll through a compelling and immersive narrative that fills the whole page, with a mix of text and media appearing in sequence. The Deep Creek Watershed and the Madison Watershed Story Maps are good examples of the Cascade format.
- Map Journal: this application allows your viewers to scroll through your narrative with the text in a side panel next to your featured media. The Bighorn Watershed Story Map is an example of the Map Journal format.
- Map Series: this application requires your viewers to click through a series of maps and media via tabs and bullets. The Musselshell Watershed Story Map is an example of the Map Series format.
Once you choose a Story Map, you can begin to add text, media, links to outside content (such as a .pdf document hosted online or a website), and maps from ArcGIS Online that you have created. See the videos below in regards to adding an ArcGIS Online map to different Story Maps:
Adding an ArcOnline map to an immersive section of a Cascade Story Map
Adding an ArcOnline map to a Map Journal Story Map
Adding an ArcOnline map to a Map Series Story Map
When you add a map into a Story Map application that was made with a .csv file downloaded from the Data Hub, you will be able to click on the site locations and a pop-up will appear that looks like the below image:
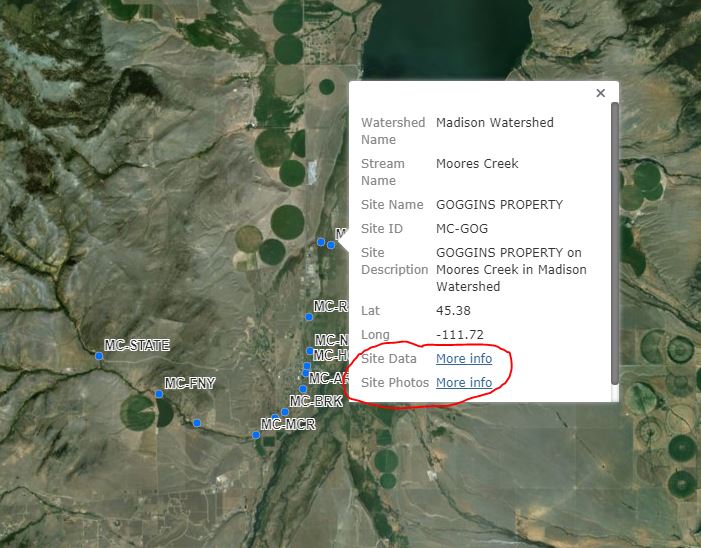 Data Hub pop-up in a Story Map
You can click on the "More Info" link next to the "Site Data" field name to open the Data Hub Data Viewer page for that specific site in another tab of your web browser, and you can click on the "More Info" link next to the "Site Photos" field name to open the Data Hub Photo Viewer page for that specific site.
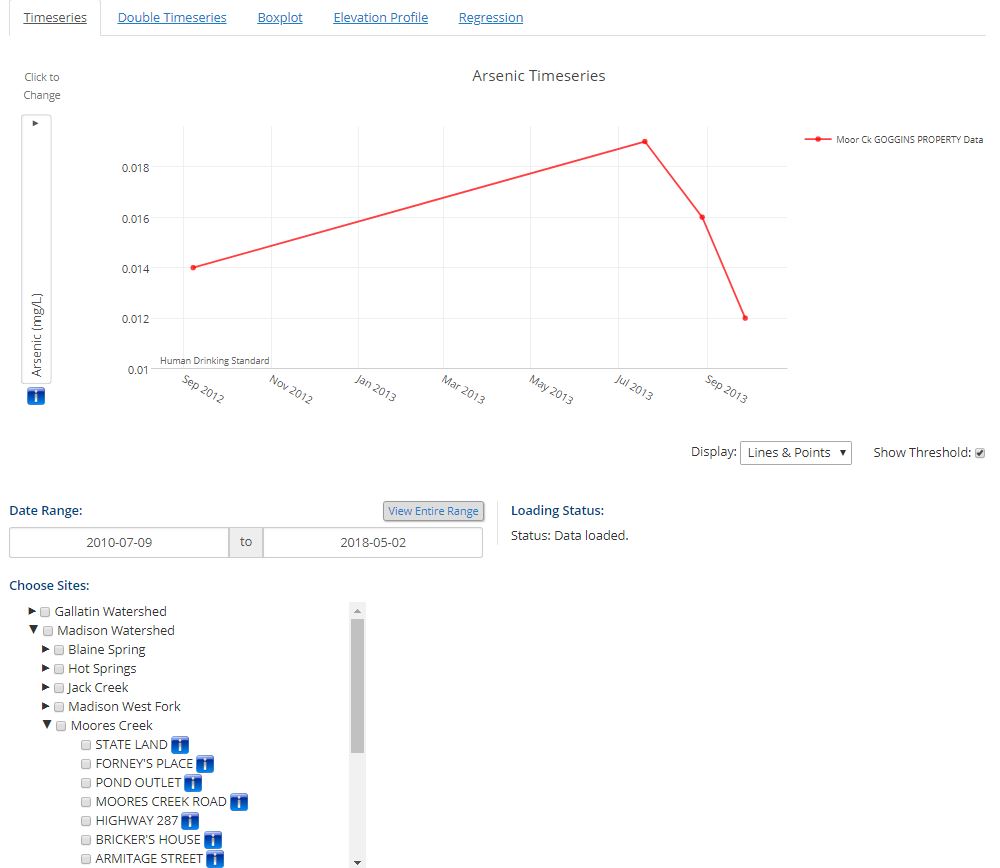
An example of what the Data Viewer might look like if you click on the "More Info" link next to "Site Data"
Make sure that both your ArcGIS Online maps and your Story Map are shared publicly! Otherwise, you'll have gaps in your Story Map, or your intended audience won't be able to view it at all!
Story Maps can be a powerful tool for conveying the message of your organization, for highlighting a project, or for simply telling the story of an area of interest.